North America update: A bubble and a boom both nearing their ends?
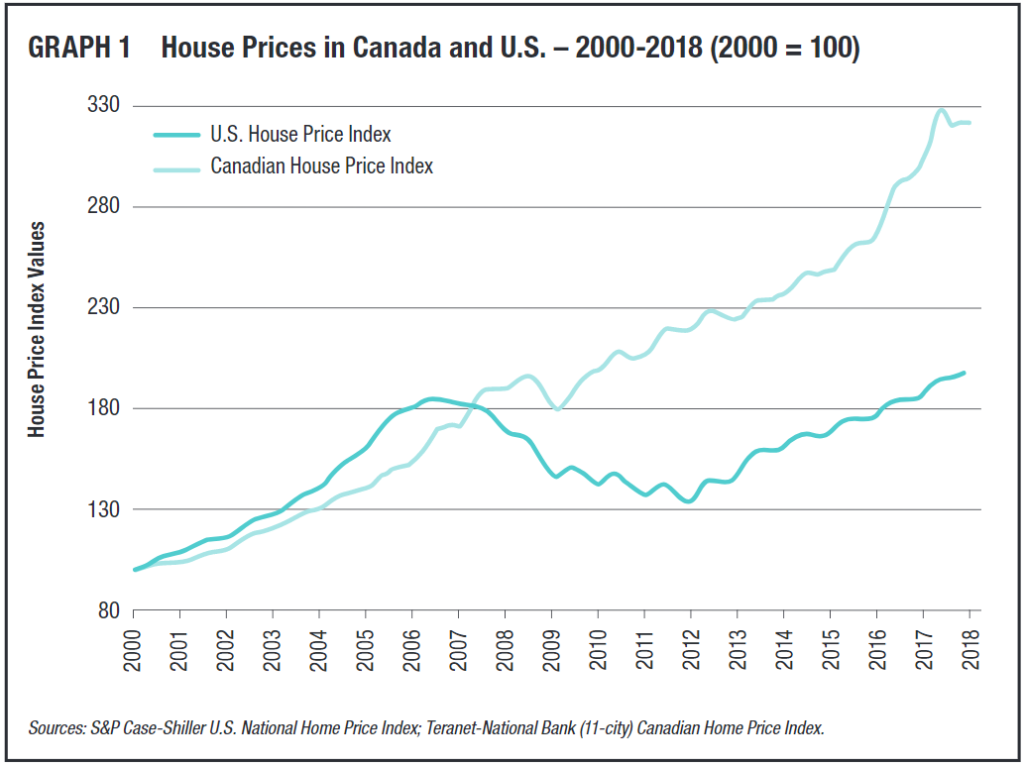
Canada’s house price inflation is bigger. Indeed, Canadian house prices surely qualify as a bubble. They have ascended to levels far higher than those at the very top of the U.S. bubble. The increases have been remarkable, and the many years of their run, with hardly a pause, has kept surprising observers (like me) who thought it would have to end before now. Canadian government officials have been worried about it for some time and have tried to slow it down by tightening mortgage credit standards and putting special taxes on foreign house buyers in Toronto and Vancouver. Meanwhile, in the United States, house prices since 2012 – for about six years, have again been booming, fueled by the cheap mortgage credit manufactured by the Federal Reserve. Average U.S. house prices are now over their bubble peak of 2006. However, they are nowhere near the records set in Canada.
Graph 1 shows the paths of average Canadian versus U.S. house prices in the 21st century, with the price indexes set to the year 2000 = 100.
The housing finance crisis in the United States caused average house prices to fall for about six years, which seemed like forever, with a cumulative drop of 27 percent. For them to regain their previous peak, which in 2012 seemed unlikely, took about five years. The Canadian crisis experience, in contrast, appears a blip: a fall of about 8 percent in eight months, then only eight months after that, house prices regained their previous peak, and went on up from there.
“Prices have ballooned for 18 years, interrupted by only one brief dip during the financial crisis, and the rule has been that prices will always go up and that you cannot lose money in real estate,” wrote the financial letter Wolf Street in May 2018. That indeed describes the belief that is induced by, and also drives, all real estate bubbles. At the same time, Canadian household debt is at a record high.
Is the Canadian bubble finally getting close to ending? The Canadian Real Estate Association reports April 2018 house sales activity was down 13.9 percent from the year before and the national average sales price declined by 11.3 percent. Its national home price index was, however, up 1.5 percent. This combination implies that the mix of sales shifted away from higher-priced houses. Wolf Street asserts the bubble’s approaching demise, at least in Toronto:
Home sales in the Greater Toronto Area, Canada’s largest housing market, and among the most inflated in the world, plunged 32% in April, compared to a year ago. … The sales slowdown was particularly harsh at the higher end…. Prices follow volume. …The average price in April for the Greater Toronto Area plunged 12.3% year-over-year.
Toronto saw a 7 percent drop afterward, but that has been followed by a flattening, so far. The Canadian national index peaked in August 2017, went down a little, and has been pretty flat for the last six months. “After a difficult second half of 2017, the Index has stabilized in recent months,” says a National Bank of Canada commentary. “Moderate rises will likely continue,” it predicts. Maybe.
Unfortunately, viewing the past shape of wavy lines doesn’t tell us just where they will go next. On a long view of historical financial cycles, however, we would have to guess it will be down, at some point. Now or later?
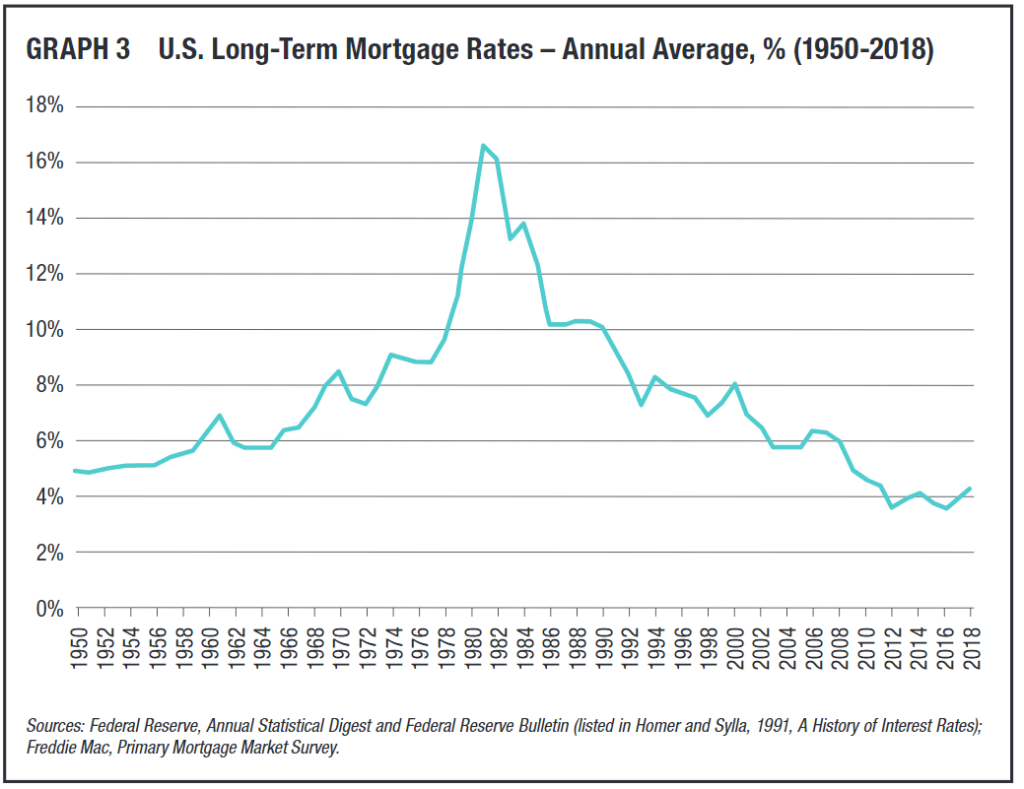
Turning to the United States, the most notable fact about U.S. mortgage debt over the last eight years is how very cheap it has been. Graph 3 shows the interest rates on long-term fixed rate mortgages, the most common U.S. mortgage loan, from 1950 to now. The average level of 2010-18, about 4 percent, is the lowest by far in this history, significantly lower than even the 1950s, and a whole lot lower than subsequent decades. Consider the distance between the solid line drawn at 4 percent and most of the graph.
The record low mortgage borrowing rates naturally turned into higher house prices. This was exactly the plan of Federal Reserve Chairman Ben Bernanke: to induce higher house prices by artificially low mortgage rates. In this, he and the Federal Reserve succeeded.
They produced a feeling of wealth in house owners but made it harder and harder for first-time buyers to afford the prices.
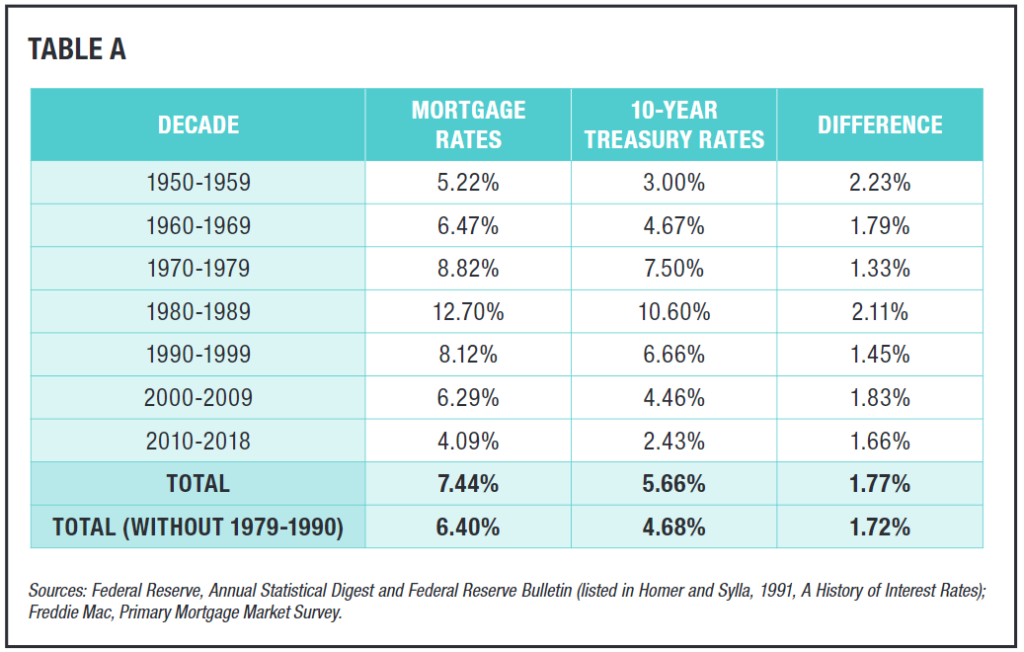
Now U.S. interest rates are rising, including mortgage rates. How high will they go? How much of the Bernanke effect will go into reverse? Table A shows average U.S. long-term mortgage rates by decade averages since 1950.
Using the starting digit of the decade averages for simplicity, we get this interesting pattern across seven decades: 5 percent, 6 percent, 8 percent, 12 percent, 8 percent, 6 percent, and 4 percent.
The 1980s stick out as abnormally high (may they not repeat!). Leaving out the years in which mortgage rates got into double digits (1979-90), the average U.S. long-term mortgage rate was 6.4 percent, or 1.7 percentage points over the average 10-year Treasury note rate of 4.7 percent. With the winding down of extreme monetary actions by the Federal Reserve, it is certainly not difficult to imagine U.S. mortgage rates returning to 6 percent.
Working in a related fashion to try to guess at what “normalized” interest rates would be, we can use the historical average real short-term interest rate of 1.3 percent. With an inflation rate of 2 percent, we then estimate normal short-term rates of 3.3 percent, a 10-year Treasury note rate of 4.4 percent and a long-term mortgage rate of 6.2 percent.
In round numbers, these guesses are quite consistent with the very old joke about the savings and loan business as “3-6-3” – that is, “take in deposits at 3 percent, make mortgage loans at 6 percent and be on the golf course by 3.”
If mortgage rates go to 6 percent from 4 percent, it seriously reduces the house-buying power of the borrower. What will the effect on house prices be? You could think they might go sideways in nominal terms, while falling in real terms to adjust. This would be a soft landing and is presumably what the Federal Reserve is hoping for. Or it might be a hard landing instead.
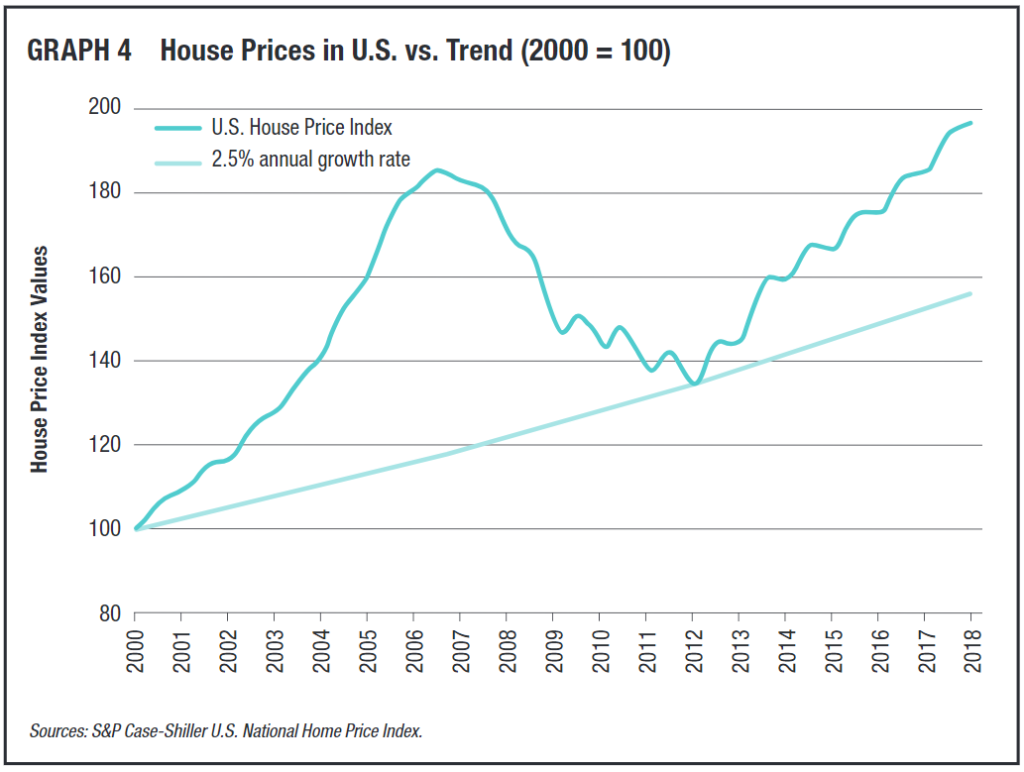
Since 1900, the average annual increase in U.S. house prices in real terms has been calculated as 0.3 percent. The average U.S. inflation rate from 2000 to now has been 2.2 percent. That means the trend rate of increase would be 2.5 percent in nominal terms. Graph 4 shows this trend growth rate against the actual prices in the U.S. bubble and the post-2012 boom. Note that in the bust after the bubble, prices fell to the trend line, then under the influence of the Federal Reserve’s treatment, took off again.
If the current level of house prices regresses to the trend very quickly, it implies a hard landing. If it regresses to the trend in any fashion, it implies a significant adjustment. Of course, we never know how the timing of such things will work out.
In sum, both Canada and the United States pose the hard question of how to adjust to extended house price inflation. Stay tuned.
Image by Andrey_Popov
