Policy Studies Carbon Pricing

Using the Clean Power Plan’s carbon fee option to offset state taxes

Earlier this month, the U.S. Environmental Protection Agency released the final version of its Carbon Pollution Emission Guidelines for Existing Stationary Sources: Electric Utility Generating Units. Known colloquially as the “Clean Power Plan,” the rule sets standards for carbon-dioxide emissions from existing power plants.

The CPP calls for an overall reduction in CO2 emissions of 32 percent from 2005 levels by 2030. However, it applies different standards to each state depending on what prescriptions, in the EPA’s view, are technically feasible. The CPP proposed two alternative standards for each state: a mass-based standard that limits the total amount of CO2 emitted, and a rate-based standard that would be applied to average emissions per kilowatt-hour of electricity.

The final rule does not set standards for Alaska or Hawaii, as the EPA claimed it lacked sufficient technical information for those two states. In addition, the CPP sets no emissions-reduction standards for Vermont, which receives its electricity largely from Canadian hydroelectric power. But each of the other 47 states are required to develop a plan to meet reduction goals, while retaining discretion as to the methods used to achieve those goals.

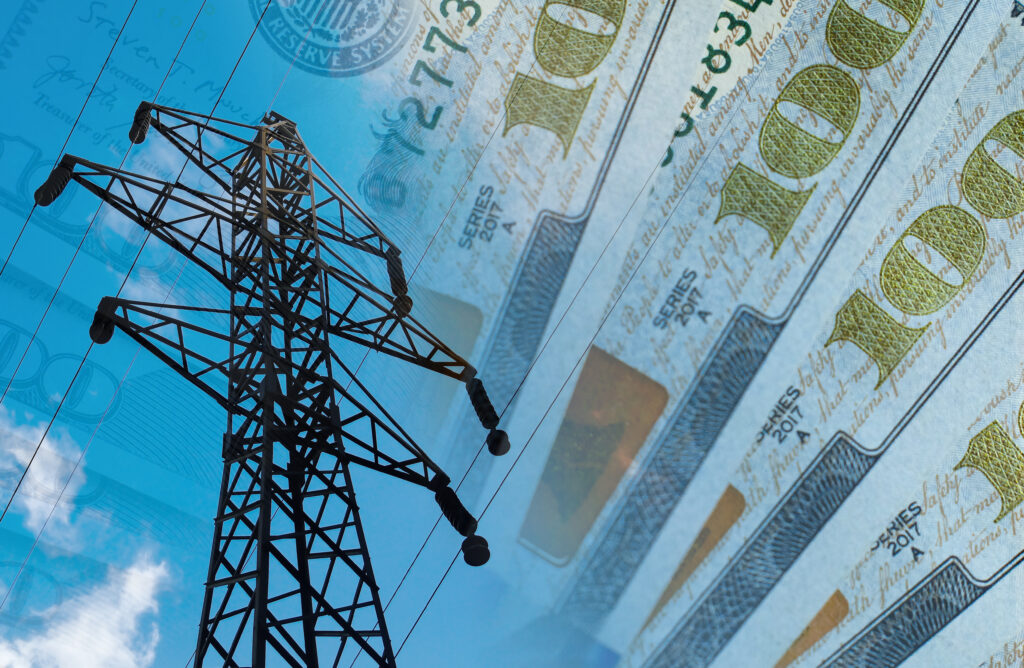
Of particular interest to those who prefer a market-based approach, the final rule stipulates that the plan “could accommodate imposition by a state of a fee for CO2 emissions from affected EGUs [electric generating units].”

Most economists view a carbon fee as a more efficient way to achieve emissions reductions than regulatory mandates or subsidies. A carbon fee has the additional advantage that it can be paired with equivalent cuts to existing taxes. Depending on the type of taxes involved, making a carbon fee revenue-neutral could largely or entirely offset the economic damage that would otherwise would stem from higher energy costs imposed by the CPP.

‘Shadow’ carbon prices

In order to estimate how much revenue a CPP-compliant carbon fee would generate, we looked to EPA modeling on the implicit carbon price needed in each state to achieve the required emissions reductions. For the calculations, we relied on the EPA’s mass-based standards, rather than the rate-based standards, as outlined in the EPA’s state-specific fact sheets.

From this modeling, the “shadow” carbon prices can be combined with state-specific limits for the amount of CO2 that can be emitted under the CPP. We used this to estimate the revenue that would be generated from a carbon fee that complies with the CPP.

Figure 1: State ‘shadow’ carbon prices for 2030

carbon price map

SOURCE: R Street analysis of EPA data

This shadow carbon price varies considerably across the states, from $26 a ton for Utah to $0 a ton for Delaware, Massachusetts, New Hampshire, New York, Oregon, Rhode Island and Washington state.

Importantly, these calculations assume the carbon fee applies only to emissions from the power sector, rather than being an economy-wide carbon tax. An economy-wide price on carbon would be substantially lower than one applied only to electric-generating plants, as it would apply to a much broader tax base. This briefing makes no attempt to calculate what economy-wide carbon fees each state would need to adopt to meet its CPP reduction goals, as such fees ultimately would generate equivalent revenue.

Carbon fee revenues

The amount of revenue each state would get annually from a CPP-compliant carbon fee is listed in Table 1. Based on the fees that would be collected should the state hit its 2030 emissions targets, the highest annual revenue is generated by Texas, at $2.5 billion, followed by Indiana, at $1.3 billion; Florida, at $1.3 billion; and Ohio, at $1 billion.

Table 1: Projected state-by-state carbon-fee revenues

State

Emissions (millions of tons)

Projected revenues ($M)

2030 (target)

2012 (actual)

2012 levels

2030 levels

AR

30

40

400

300

AL

57

76

836

627

AZ

30

40

800

600

CA

48

46

690

720

CO

30

42

882

630

CT

7

7

7

7

DE

5

5

0

0

FL

105

118

1,416

1,260

GA

46

63

945

690

IA

25

38

570

375

ID

1

1

24

24

IL

66

96

960

660

IN

76

107

1,819

1,292

KS

22

34

680

440

KY

63

91

182

126

LA

35

43

86

70

MA

12

13

0

0

MD

14

20

80

56

ME

2

2

4

4

MI

48

70

350

240

MN

23

28

476

391

MO

55

78

1,248

880

MS

25

26

260

250

MT

11

18

360

220

NC

51

59

59

51

ND

21

33

396

252

NE

18

27

648

432

NH

4

5

0

0

NJ

17

15

75

85

NM

12

17

221

156

NV

14

16

224

196

NY

31

35

0

0

OH

74

102

1,428

1,036

OK

40

53

742

560

OR

8

8

0

0

PA

90

117

702

540

RI

4

4

0

0

SC

26

36

216

156

SD

4

3

42

56

TN

28

41

615

420

TX

190

208

2,704

2,470

UT

24

31

806

624

VA

27

27

108

108

WA

11

7

0

0

WI

28

42

672

448

WV

51

72

1,080

765

WY

32

50

900

576

SOURCE: R Street analysis of EPA data

Revenues from a CPP-compliant carbon fee exceed many individual state taxes. Many states would be able to reduce or eliminate state corporate, income, gasoline or other taxes if they adopted a tax-swap approach.

For example, in Texas, revenue from a CPP-compliant tax would be greater than what the state currently collects in taxes on insurance; natural-gas production; cigarettes and tobacco; alcoholic beverages; hotels; and utilities. The fees could offset a 9 percent cut in the sales tax; a 52 percent cut in the franchise tax; a 59 percent cut in motor-vehicle sales and rental taxes; a 64 percent cut in the oil-production tax; or a 75 percent cut in the fuel tax. The insurance and utilities taxes could be phased out entirely, and still leave $45 million to apply toward the state’s $267 million in miscellaneous taxes.

It should be stressed that these estimates do not represent projections about the total cost of the CPP to the wider economy. How costly the CPP ultimately proves to be will depend both on how each state chooses to go about meeting the required reduction goals. The estimates do, however, provide a sense both of how costly meeting the CPP goals via a carbon fee would be, and how much revenue would potentially be available for offsetting tax cuts.

Featured Publications