Don’t expect regulations to be a viable climate strategy
“Insanity is doing the same thing over and over and expecting different results” goes the saying, attributed to Albert Einstein. Einstein was speaking to quantum mechanics, as he generally believed physics—among other things—follows a path of least resistance. This same lesson can be applied in President-elect Biden’s initial climate strategy, which essentially seems to be operating from the same playbook as President Obama. The approach is executive-centric, relying on executive authority under existing statutes to implement new climate regulation.
While the media and politicos lambasted President Trump for his retrenchment on environmental regulations, the political theater stands in contrast with the data. Under President Trump, all of President Obama’s emission targets were met. The simple reason for this is that the tools available for executive climate action are just not all that effective, and examination of the data shows them to have minimal emissions benefit.
Even without climate policy, there was climate progress
The chart below shows several key metrics in evaluating President Trump’s climate legacy, especially relative to President Obama. Shown are U.S. CO2 emissions with 2020 data coming from pre-pandemic projections, compared with 2016’s projected emissions. Also shown is the emissions target for 2020 that President Obama promised in 2009, and the latest projected emissions for 2020 which include the pandemic’s impact.
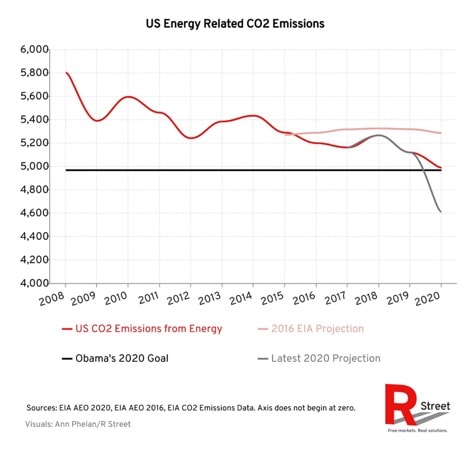
Sources: EIA AEO 2020, EIA AEO 2016, EIA CO2 Emissions Data. Axis does not begin at zero.
A few takeaways are immediately apparent. The first is that despite an emissions bump thanks to economic growth following tax reform, emissions in 2018 still came in under what was projected in 2016, and 2019 CO2 emissions were 199 million metric tons below their 2016 projection. The second is that despite Trump’s active attempts to unwind any role for the executive branch in climate policy, the overall trend of emissions under his presidency looks barely different than under President Obama’s. The third is that even before the pandemic, it was expected that Trump was on track to meet the emission target for 2020 that President Obama promised to the international community at the UN climate conference in Copenhagen in 2009—a target that in 2015 Obama was critiqued for being unlikely to meet.
Emissions data, though, does not tell the whole story. Emissions are highly susceptible to business cycles, as the graph above shows a plunge with the Great Recession and a bump after tax reform. Measuring the carbon intensity of the economy controls these effects, offers much more insight as to how “clean” an economy is, and gives insight as to the propensity of the economy to either increase or decrease emissions in the future. Carbon intensity also generally improves naturally, as economies grow at a faster rate than their emissions. The graph below compares projected carbon intensity with actual carbon intensity, with projections taking U.S. Energy Information Administration (EIA) projected emissions with Congressional Budget Office (CBO) projected economic growth.
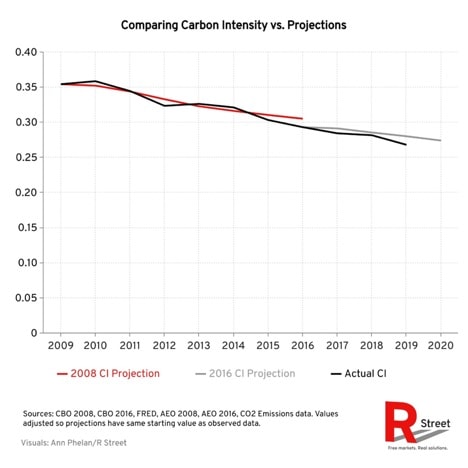
Sources: CBO 2008, CBO 2016, FRED, AEO 2008, AEO 2016, CO2 Emissions data. Values adjusted so projections have same starting value as observed data.
While the above graph may not be the most common metric, it essentially offers a big insight: neither Obama nor Trump had much deviation from the projected carbon intensity when they took office. In plain English, it means that for both presidents the economy only got slightly “cleaner,” and economic performance was likely a far bigger determining factor in emissions performance. President Obama’s economy performed below projections from when he took office, and that likely is a bigger reason for falling emissions under his administration. President Trump modestly exceeded economic projections for 2019, though 2020 data will show a steep economic recession resulting from the pandemic, and that too will be reflected in the data.
Regulations were not as effective as expected
The takeaway so far is that President Obama’s climate-focused regulations probably had little to no benefit, but a deeper dive on the data shows it might be worse. The chart below compares average annual carbon intensity improvements, and includes Obama’s last term and Trump’s single term (sans 2020 data). Carbon intensity improvements were essentially no different under Trump than Obama at an average 2.9 percent improvement for each, and ironically Trump outperformed Obama’s second term (a 2.4 percent average annual improvement)—ostensibly when his regulations should have had the most benefit.
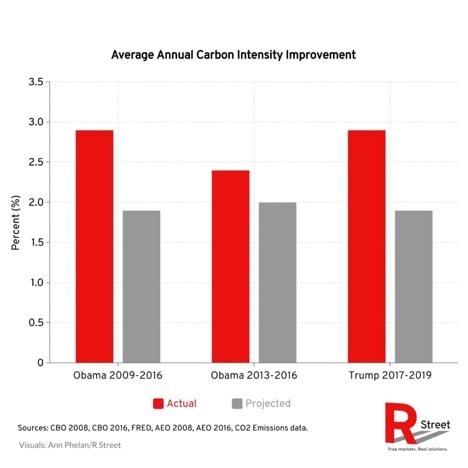
Sources: CBO 2008, CBO 2016, FRED, AEO 2008, AEO 2016, CO2 Emissions data.
The above data is surprising. How did a president actively trying to undo climate policy beat the climate record of one that made it a staple of his agenda? There are potential reasons that both hurt or help either president.
One possible explanation against Trump’s policies is that there was a substantial lag effect between when Obama adopted his policies, and the benefits then spilled over to under President Trump. This is possible, but one should note that Trump jettisoned most of Obama’s regulations, and a number were also overturned early in 2017 under the Congressional Review Act. Another possible explanation against Trump is that much of the climate progress happened at the subnational level. The data for states is not out yet, but much of the subnational climate movement has been focused on policies that do not even take effect until after 2020, so it is unlikely that it explains the majority of the data trend.
An alternative explanation is that natural gas has played a bigger role in decarbonization than expected. Despite President Trump undoing the Clean Power Plan, its 2030 emission target of 32 percent below 2005 levels was reached in 2019, and this is largely thanks to increased natural gas adoption, and to a lesser extent, increased renewable energy adoption. According to EIA data, natural gas has contributed 3.4 billion metric tons to emission abatement since 2005, and renewables contributed 2.1 billion metric tons. A policy of non-interference may have simply let the private sector express its preference for cheaper fuels, which allowed for more rapid deployment of natural gas and renewable energy.
Another interesting possibility, though, is that some of President Obama’s environmental efforts may have had unintended effects on emission abatement. For example, long delays for review under the National Environmental Policy Act (NEPA) have made it difficult to deploy newer and more efficient energy and transportation infrastructure. President Obama’s attempts to expand environmental considerations in NEPA review may have exacerbated delays, and a 2016 report found that a “lack of expertise” with respect to environmental evaluations was a continuing reason for delays. Additionally, President Obama’s push for more stringent efficiency standards for appliances raised initial purchase costs and may have caused consumers to retain older, more polluting stock. And efficiency regulations for vehicles may not have fully achieved the hoped-for benefit thanks to the “rebound effect,” whereas it became cheaper to drive cars and people used them more.
The salient takeaway from the data is that regulations do not seem to have as much benefit as is often believed. Institutional bias is likely a big reason for high expectations of benefits; policymakers tend to be more optimistic about the utility of the policies they can control rather than factors beyond their reach. But the data has consistently shown that regulations are just not the best tool in the box. When the CBO, the nation’s most trusted source of nonpartisan economic analysis, compared climate policies they concluded that command-and-control policies (i.e. regulations) are the least effective. This is a conventional understanding of economics, as regulations are prescriptive in how targets are achieved, and fails to allow for the dynamism of a free market economy that could capture lower cost abatement opportunities.
Increasingly, environmental scholars are concurring with the CBO’s take. In 2016, Ted Nordhaus and Jessica Lovering compared the carbon intensity of major economies before and after implementing major climate policies and found that in almost all cases, the rate of carbon intensity improvement got worse after the fact. In 2018, Adele Morris and Samantha Gross stated “[The] seesaw of regulatory policy is grossly inefficient, particularly when trying to steer the deployment of long-lived capital toward a lower-carbon future.” And, in 2020, Nathan Richardson noted, “The result is that, in my view, the [Clean Air Act] can no longer be considered a reliable and effective vehicle for broad climate policy.”
Obama had a hard time with the courts—for Biden it will be harder
The above data shows that even if President-elect Biden maximally pursues executive action to address climate change, he should not expect much deviation from the current trend. But there is another reason that Biden should not put too much stock in a return to regulation, which is that he will have much more difficulty in getting through the inevitable litigation that will come in response to his regulations.
While President Obama succeeded in finalizing many regulations, some of the biggest faced stiff and ultimately failing court battles. In 2015, the Mercury and Air Toxics Standards (MATS) regulation was overturned by the Supreme Court. The Waters of the United States (WOTUS) regulation received a nationwide stay in 2015 by the 6th Circuit as its contained arguments were deemed “facially suspect.” And, in 2016, the Supreme Court stayed the Clean Power Plan—marking the first time in history the Supreme Court stayed a regulation before any litigation had been appealed.
The upshot from the Obama years of regulatory court battles is that the Supreme Court, even when it was a 5-4 conservative split, was already deeply skeptical of the executive’s increasingly open-ended interpretation of the authority it had been delegated under 40+ year old environmental laws. Now with a 6-3 conservative majority, President-elect Biden has even less hope of winning the legal battle than his predecessor.
Conclusion
There just is not a strong argument to be made in the data that an executive-centric climate agenda could be at all effective. The most viable pathway for progress on climate change is compromise, and the passage of legislation that is amenable to a Republican Senate. This could be carbon offset verification, forestry and natural carbon sinks, energy innovation and other pragmatic policies that have garnered bipartisan support in the past few years. Many of the most fruitful emissions reductions policies may not even be direct climate policy, but rather take the form of sound economic policy with climate co-benefits, such as reducing barriers to capital stock turnover via streamlined regulatory or tax policy.
Tellingly, the former energy secretary under President Obama, Ernest Moniz, stated for the Washington Post, “My view of reality is that it’s very, very hard to get major systemic change in this country without some considerable degree of bipartisan support.” President-elect Biden would be wise to follow Moniz’s advice, given that he has seen firsthand how ineffectual the go-it-alone approach can be. The data above as well as the track record of court cases concurs with Moniz’s views. The Biden administration should be serious about climate policy and work toward bipartisan legislation, not pursue an executive-only approach that yields limited progress.