
Need for Speed: An Analysis of Speed to Market and Cost Results of Competitive Transmission: Part 2—Timing
This is the second in a five-part series examining the performance of transmission competition relative to the outcomes of similar incumbent utility transmission development. The series will focus on the timing and cost of transmission competition in the United States, reviewing relevant literature, evaluating outcomes of similar competitive transmission mechanisms in other countries, and concluding with policy recommendations.
Summary
This part of the series evaluates whether competitive transmission development processes meaningfully affect the speed with which transmission infrastructure is planned and placed into service. While critics of the Federal Energy Regulatory Commission (FERC) Order 1000 competition frequently argue that competitive solicitations create unnecessary delays, this analysis examines whether the empirical evidence supports those claims. Through regional case studies of the Southwest Power Pool (SPP), MISO, PJM, the New York Independent System Operator (NYISO), the California Independent System Operator (CAISO), and the Independent System Operator of New England (ISO-NE), we compare competitive and incumbent projects across two key timing metrics: the total time required to move a project from identified need to in-service completion and whether projects meet their initially estimated in-service dates. Together, these case studies provide a broader understanding of how transmission processes perform in practice and how timing outcomes compare.
The timing and schedule performance of competitive transmission facilities—how quickly projects are built and whether or not they stay on schedule—has become a key argument for utilities attempting to recover their federal rights of first refusal (ROFR). Contrary to previous analysis, our study finds that Order 1000 transmission competition does not lead to significant delays. In fact, even with solicitations and evaluations, the few competitive projects that have been placed into service have done so faster than, or on a timeline comparable to, similar incumbent projects. While the competitive project sample size limits the significance of the result, the outcomes may indicate that competitive projects are not objectively slower than incumbent projects. Additionally, when it comes to meeting initially estimated in-service deadlines, competitive projects perform better or similarly to comparable incumbent projects. While competitive solicitations take time, this time does not add to the overall in-service date of the facility as compared to an incumbent building similar facilities.
Our regional transmission organization/independent system operator (RTO/ISO) case studies analyze comparable competitive and incumbent projects to identify any impacts of competitive processes on the timeline necessary to plan, develop, and construct transmission facilities. Specifically, we analyze quantitative data on two key considerations related to transmission development timing:
- How long does it take to plan and develop transmission once a need is identified?
- When is a project actually placed into service relative to its expected in-service date?
To create robust comparisons, each region’s data is compared with other similar projects within that region. Various regions utilize divergent planning and development frameworks with widely variable project tracking processes and data quality and availability across regions. Some, like SPP and MISO, collect and maintain data for competitive projects in a coherent and consistent manner, which helped inform our analysis. However, we identify SPP as best in class in reporting non-competitive projects in a consistent and accurate manner to provide regulators and policymakers insight into the time and cost data of all projects. SPP’s consistent, detailed, and verified competitive and incumbent data, largely unavailable in other RTOs/ISOs, enhanced our ability to focus on the region. In Part 5 of this series, we will discuss our overall findings in more detail and recommend that other RTOs/ISOs follow SPP’s model in tracking incumbent and competitive projects. We will also recommend that FERC use its authority under Section 304 of the Federal Power Act to request a one-time informational report on transmission planning and development to gather information from utilities using data collection methods similar to SPP’s. These recommendations will allow policymakers to better understand how well incumbent and competitive projects are planned and developed and will better inform regulatory changes that can improve development timelines and cost outcomes.
While SPP’s data on speed and cost components of competitive and non-competitive transmission planning and development was the most useful for our analysis, we gathered sufficient data in each region to provide meaningful case studies. However, due to the small number of competitive projects currently in service or the fidelity of data on incumbent or competitive projects, some parts of our analysis required project- or region-specific treatment to provide reliable estimates.
Data and Methodology
Project timelines are evaluated to understand how long transmission projects take to move from identifying a need to in-service completion of the project that solves that need and how those timelines may have changed over the course of development. There are a few measurable and relevant dates throughout the transmission planning and development process:
- Identification of need
- Award or approval date
- Initial estimated in-service date
- In-service date
This analysis compares expected timelines at the planning stage with actual durations revealed through project development and construction. By examining the available data, we identified patterns in delays, schedule extensions, and delivery performance. Given the unique treatment required to assess each region, the data and measurements utilized will be described in more detail within the region-specific sections that follow.
The sample used in this timeline analysis relies on large new greenfield competitive and incumbent projects. Importantly, using only greenfield incumbent projects is required for a reasonable timeline comparison, as rebuild or reconductor projects (even large ones) have inherent timing advantages associated with ownership of the retired facility. The timing sample includes all incumbent projects that are primarily transmission lines (projects with >1 line mile, excluding substations), greater than $50 million, with in-service dates from January 2018 through Q3 2025 (or May 2026 for MISO and SPP). Competitive projects are those greenfield transmission line projects developed via competitive processes in transmission planning regions and placed into service through Q3 2025 (or May 2026 for SPP). Notably, this sample includes all greenfield projects included in the broader sample we will use when comparing incumbent and competitive cost impacts in Part 3.
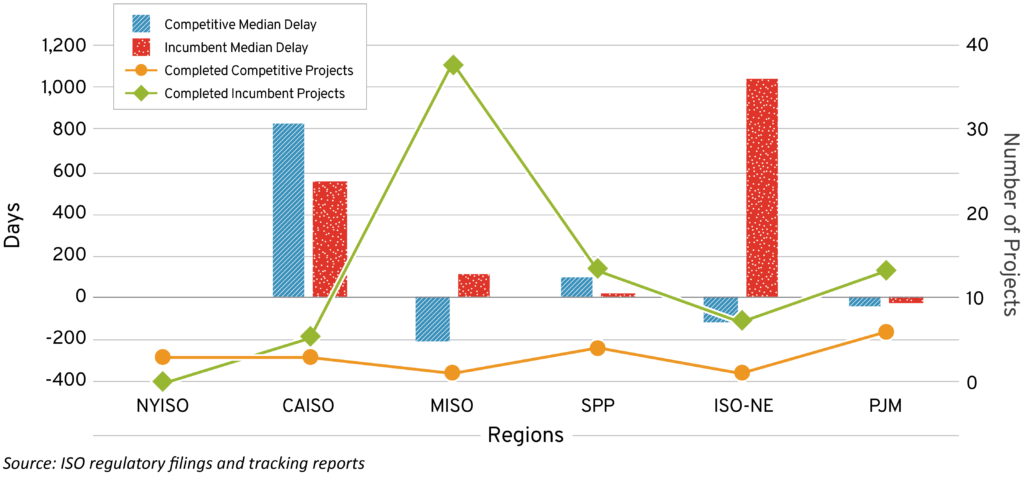
To summarize results across projects, our timing analysis primarily relies on median timelines as shown in the following charts, which better account for outliers and unusually long delays that can distort averages. We also examined simple averages to provide an overall measure of project duration within each region’s processes. By assessing comparable types of projects across similar scales and complexities, the analysis offers insight into relative efficiency and the predictability of project delivery. The data below shows each region’s aggregate time to plan and develop incumbent and competitive transmission, from the identification of the need for the project to placing the transmission project in service. The graphs that follow also illustrate how well incumbent and competitive transmission projects meet expected in-service dates. Region-specific case studies provide details on the calculation and fidelity of data used in the analysis.
Figure 1 shows that based on the limited sample size, competitive project timelines in MISO and SPP were either comparable to or shorter than incumbent median timelines. More broadly, competitive projects were developed faster than incumbent projects in most regions analyzed, with PJM representing the primary exception where incumbent projects demonstrated shorter overall development timelines.
Figure 1: Median Total Completion Time by Region
Note: No comparable incumbent sample was available for NYISO
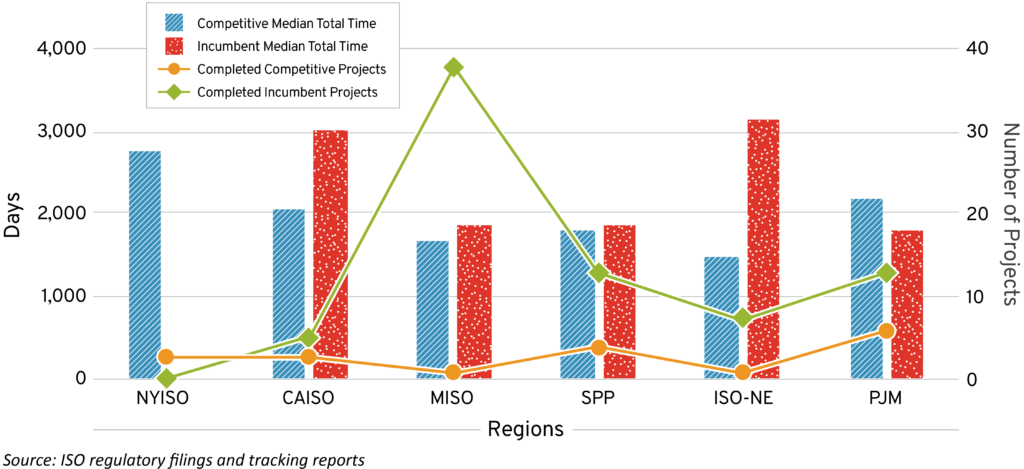
Figure 2 shows that incumbent transmission projects frequently experienced meaningful delays relative to their originally projected in-service dates, particularly in CAISO and ISO-NE. By comparison, several competitive projects were completed ahead of schedule, as reflected by negative delay values in the chart. These results suggest that the ability to meet projected in-service timelines may depend more on project-specific execution, permitting, siting, and construction conditions than whether a project is developed through a competitive or incumbent framework.
Figure 2: Median Delay by Region
Note: Negative delay values indicate projects completed ahead of schedule
Regional Analysis: Southwest Power Pool (SPP)
SPP’s regional transmission planning processes can drive new or proposed transmission facilities as a result of nearly a dozen FERC-approved processes including generation interconnection, high-impact large load generator requests, the region’s Integrated Transmission Planning Assessment, transmission service requests, and interregional transmission proposals. As explained in Attachment O of SPP’s Open Access Transmission Tariff (OATT), all of these processes lead to an annual transmission expansion plan. SPP’s governing rules (and Attachment Y of SPP’s OATT in particular) dictate which transmission needs or projects can be developed through a competitive process or merely designated to the incumbent utility or utilities. As part of SPP’s Integrated Transmission Planning Assessment (ITP), SPP produces recurring ITP assessment reports following a multi-month planning process that uses a 10-year planning horizon. Part of SPP’s ITP is the “needs assessment,” which covers economic, reliability, public policy, and reliability needs related to transmission. While the needs are identified as part of the ITP, they do not necessarily have to be solved via transmission facilities through the planning process. The needs assessment starts approximately a year before the assessment report is released. Ultimately, the ITP cycle ends with the ITP assessment report, which is finalized, approved by SPP’s board of directors, and published.
Since our analysis attempts to determine how competitive and non-competitive projects compare over the planning and development life of a project, identifying a common starting point for development in each region (or a reasonable proxy for that starting point) is imperative. For competitive projects in SPP, we chose the board’s issuance of the ITP assessment approving the need for the facility as a starting point. For incumbent projects in SPP, we used a starting point of SPP determining a facility was required as part of a planning study. With SPP’s superior data collection, tracking, and transparency, the authors have initial expected in-service dates, notice to construct date, expected in-service date, actual in-service date, and project status—all part of SPP’s quarterly project tracking report. With this information, we can identify from initial study reports and assessments when incumbent and competitive projects were identified as needed, the projects’ initial expected in-service date, the date they need to be in service, and—for our sample of in-service projects—the approximate date the projects were placed into service.
SPP has brought three competitive projects into service within the last year and a half, with public sources indicating a fourth project was placed into service within the past month. Various ITPs identified all four of these competitive projects, in particular the 2019, 2020, and 2021 ITPs. Relevant to this timing analysis, SPP’s competitive solicitations follow the procurement model, where the RTO—based on the needs assessment and submitted solutions to those needs—creates a portfolio of projects screened by staff and the board. Once SPP’s board of directors approves the ITP assessment, the RTO can open a solicitation for projects identified during the ITP process. For projects meeting the criteria for competition, SPP opens a months-long solicitation with the issuance of a request for proposal (RFP). After developers submit proposals, SPP uses an independent industry expert panel (IEP) to score the proposals and recommend a winning developer and proposal. The SPP board of directors then selects the developer and proposal to construct the project.
Table 1 provides detailed timing metrics for SPP’s competitive transmission projects, including the length of solicitation periods, overall project development timelines, and performance relative to initial in-service estimates. SPP provides one of the strongest datasets for evaluating timing outcomes because it consistently tracks project milestones and development schedules. The following table demonstrates that even with solicitation periods lasting nearly a year in some cases, overall development timelines remained comparable to incumbent projects in the region.
Table 1: SPP Competitive Transmission Projects
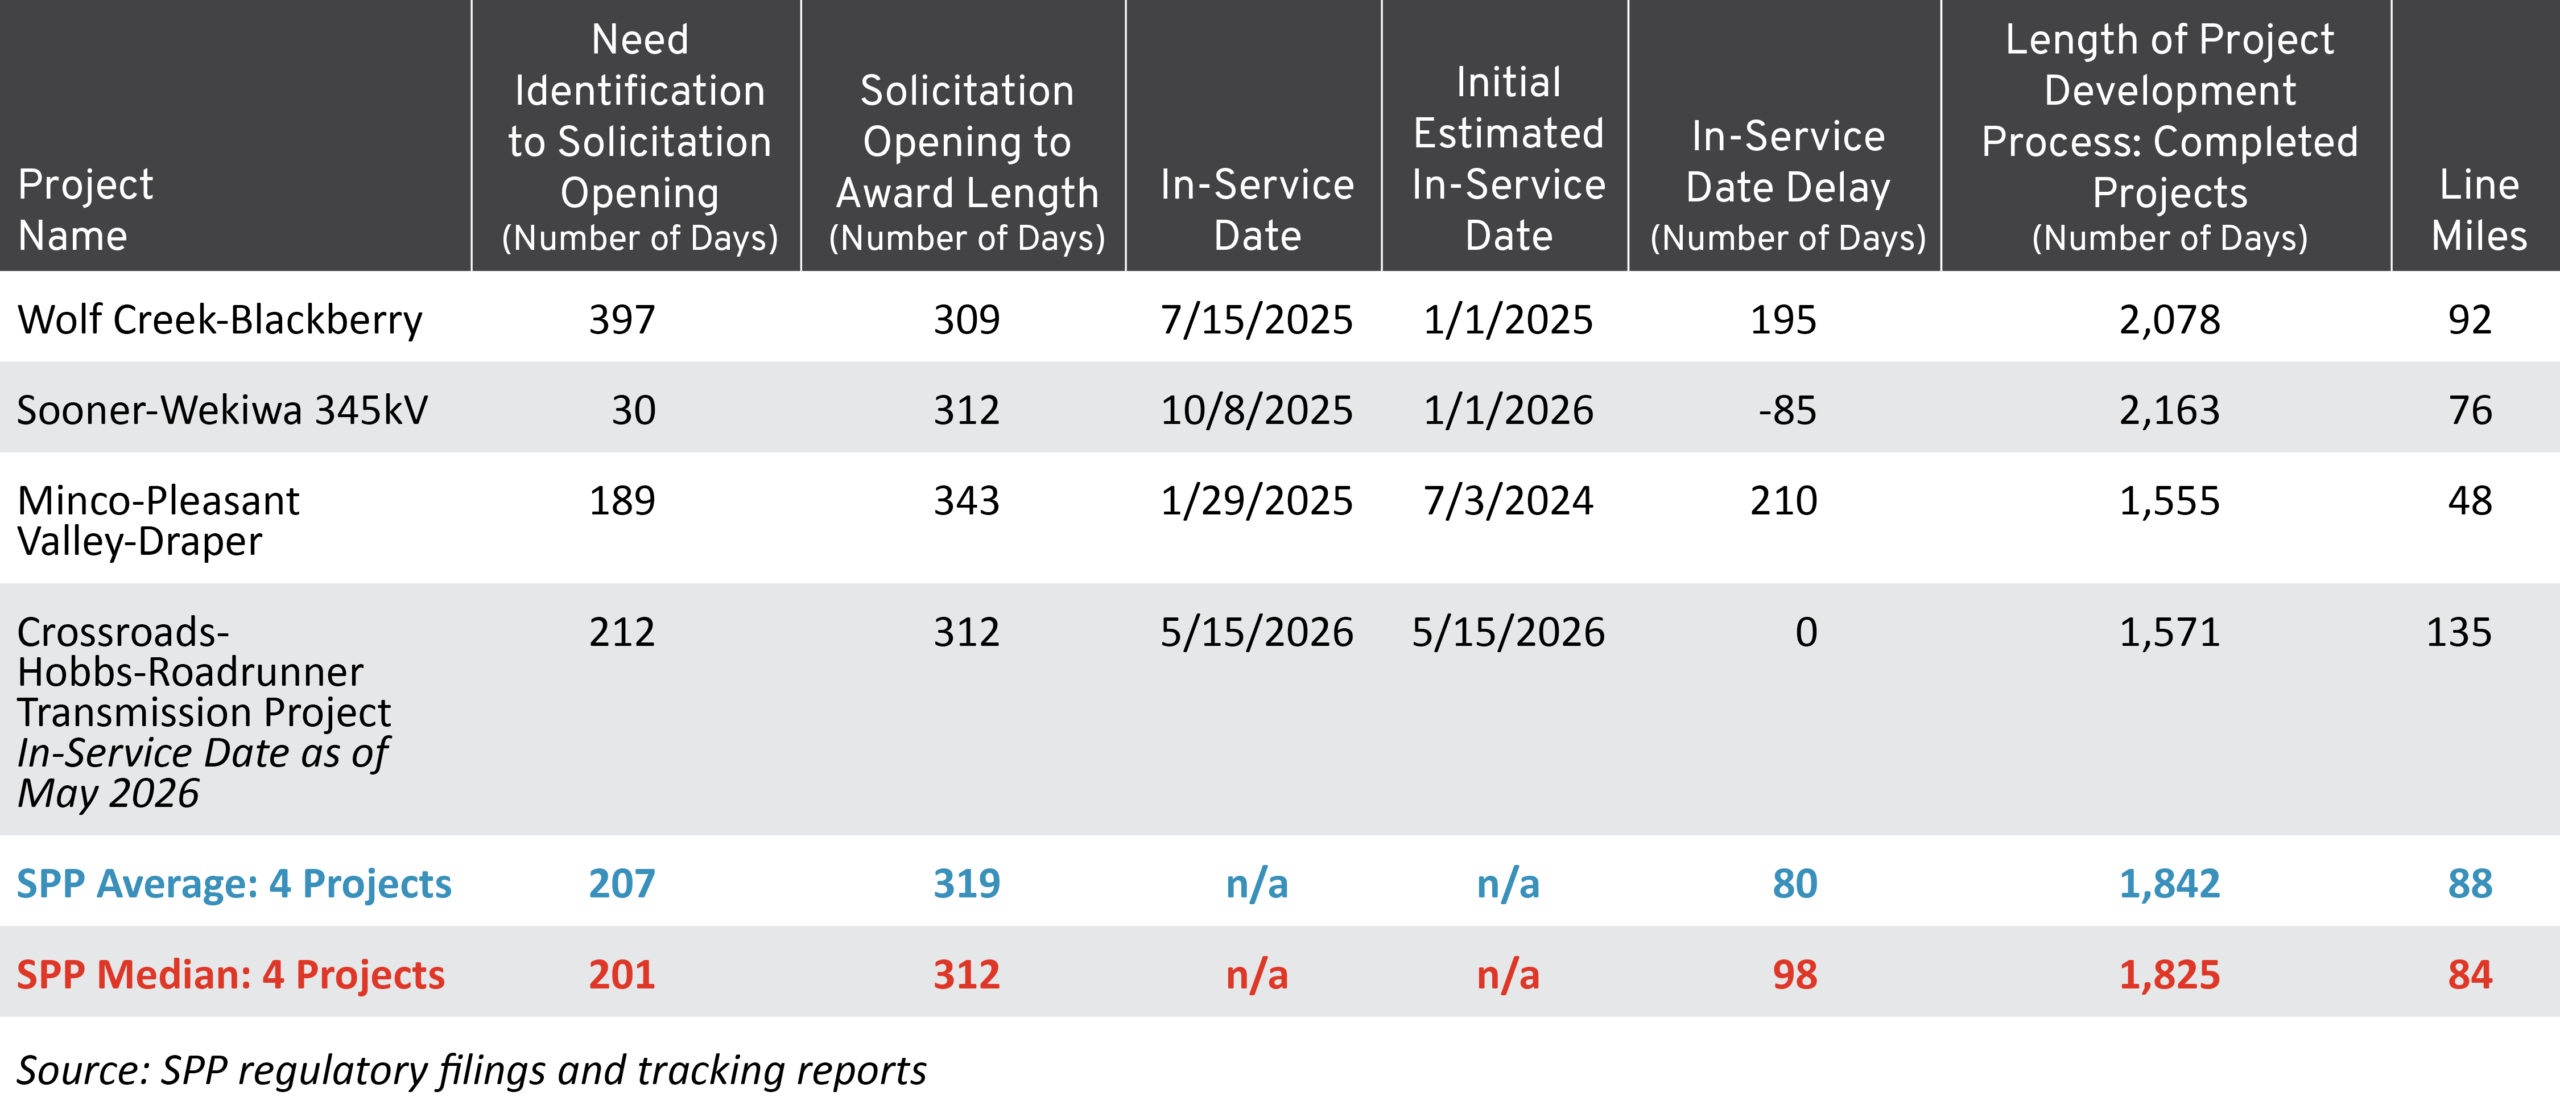
As part of its 2019 ITP assessment issued Nov. 6, 2019, the SPP board identified the need for the Sooner-Wekiwa 345 kV line. The project had a needed in-service date of Jan. 1, 2026. SPP solicited a request for proposal 30 days after publication of the ITP assessment. The solicitation period lasted 312 days until the IEP provided its recommended project development—the proposal that received the highest score from the IEP. The IEP’s recommendation was summarized as follows:
The IEP recommends Proposal E as the Recommended RFP Proposal. Proposal E received the highest overall point allocation, and Proposal E received the highest point allocation in the scoring categories of Project Management and Operations, the third highest point allocations in the scoring category of Engineering Design, and fourth highest in Finance. In addition to receiving the highest point allocation, the IEP determined the designation was appropriate because Proposal E best addressed a significant risk the IEP identified to project success — the timely acquisition of Rights of Way (ROW). This proposal also demonstrated significant capabilities and historical success in construction management and in the ability to operate and maintain a 345 kV transmission line.
The selected development was a 76-mile-long line, and the developer was issued a notice to construct a few months after the IEP recommendation. While the IEP studied and scored any proposed in-service schedule guarantees provided in response to the RFP, those portions of the selection report were redacted. Ultimately, the Sooner-Wekiwa project was placed into service in October 2025—nearly three months ahead of its estimated and needed in-service date. The project was in planning and development, between the time the SPP Board identified the need for the project in the 2019 ITP and its in-service date, for 2,163 days.
The need for the Wolf Creek-Blackberry line was also identified in the 2019 SPP ITP assessment. SPP waited until Sept. 28, 2020 to issue the RFP. After identifying an issue with the first RFP, the SPP board issued a replacement RFP on Dec. 7, 2020. We used the second RFP in this analysis to measure the length of the solicitation, as it is more representative of the region’s typical process. However, any delay caused by the reissuance is reflected in our overall timing analysis. The IEP recommended a developer for the project on Oct. 12, 2021, meaning the solicitation period after the second RFP lasted 309 days. The developer the IEP chose to recommend unanimously for the 92-mile-long project received the highest points of any proposal. Although the selection report redacted material data regarding the cost schedule guarantees of the winning bidder, subsequent public information confirmed the winning bidder did have an in-service guarantee of 1.5 basis point ROE reduction for every month of delay. With a needed in-service date of Jan. 1, 2026 and an initial estimated in-service date of Jan. 1, 2025, the project was actually placed into service July 15, 2025—195 days after the initial estimate. The total time between when the board identified the need for the facility and it being placed into service was 2,078 days.
The 2020 ITP assessment (published Oct. 27, 2020) identified the need for the Minco-Pleasant Valley-Draper line, and an RFP for developers for the project was issued on May 4, 2021. On April 12, 2022, the IEP issued its recommendation for the developer of the 48-mile-long project, with a needed in-service date of Jan. 1, 2025 and an initial estimated in-service date of July 3, 2024. Ultimately, the project went into service on Jan. 29, 2025—210 days after the initial expected in-service date and 1,555 days after the SPP board identified the need for the project. Nevertheless, similar to the Wolf Creek-Blackberry line and the just-in-service Crossroads-Hobbs-Roadrunner project, the Minco-Pleasant Valley-Draper project had an in-service guarantee with a 1.5 basis point per month penalty for delay.
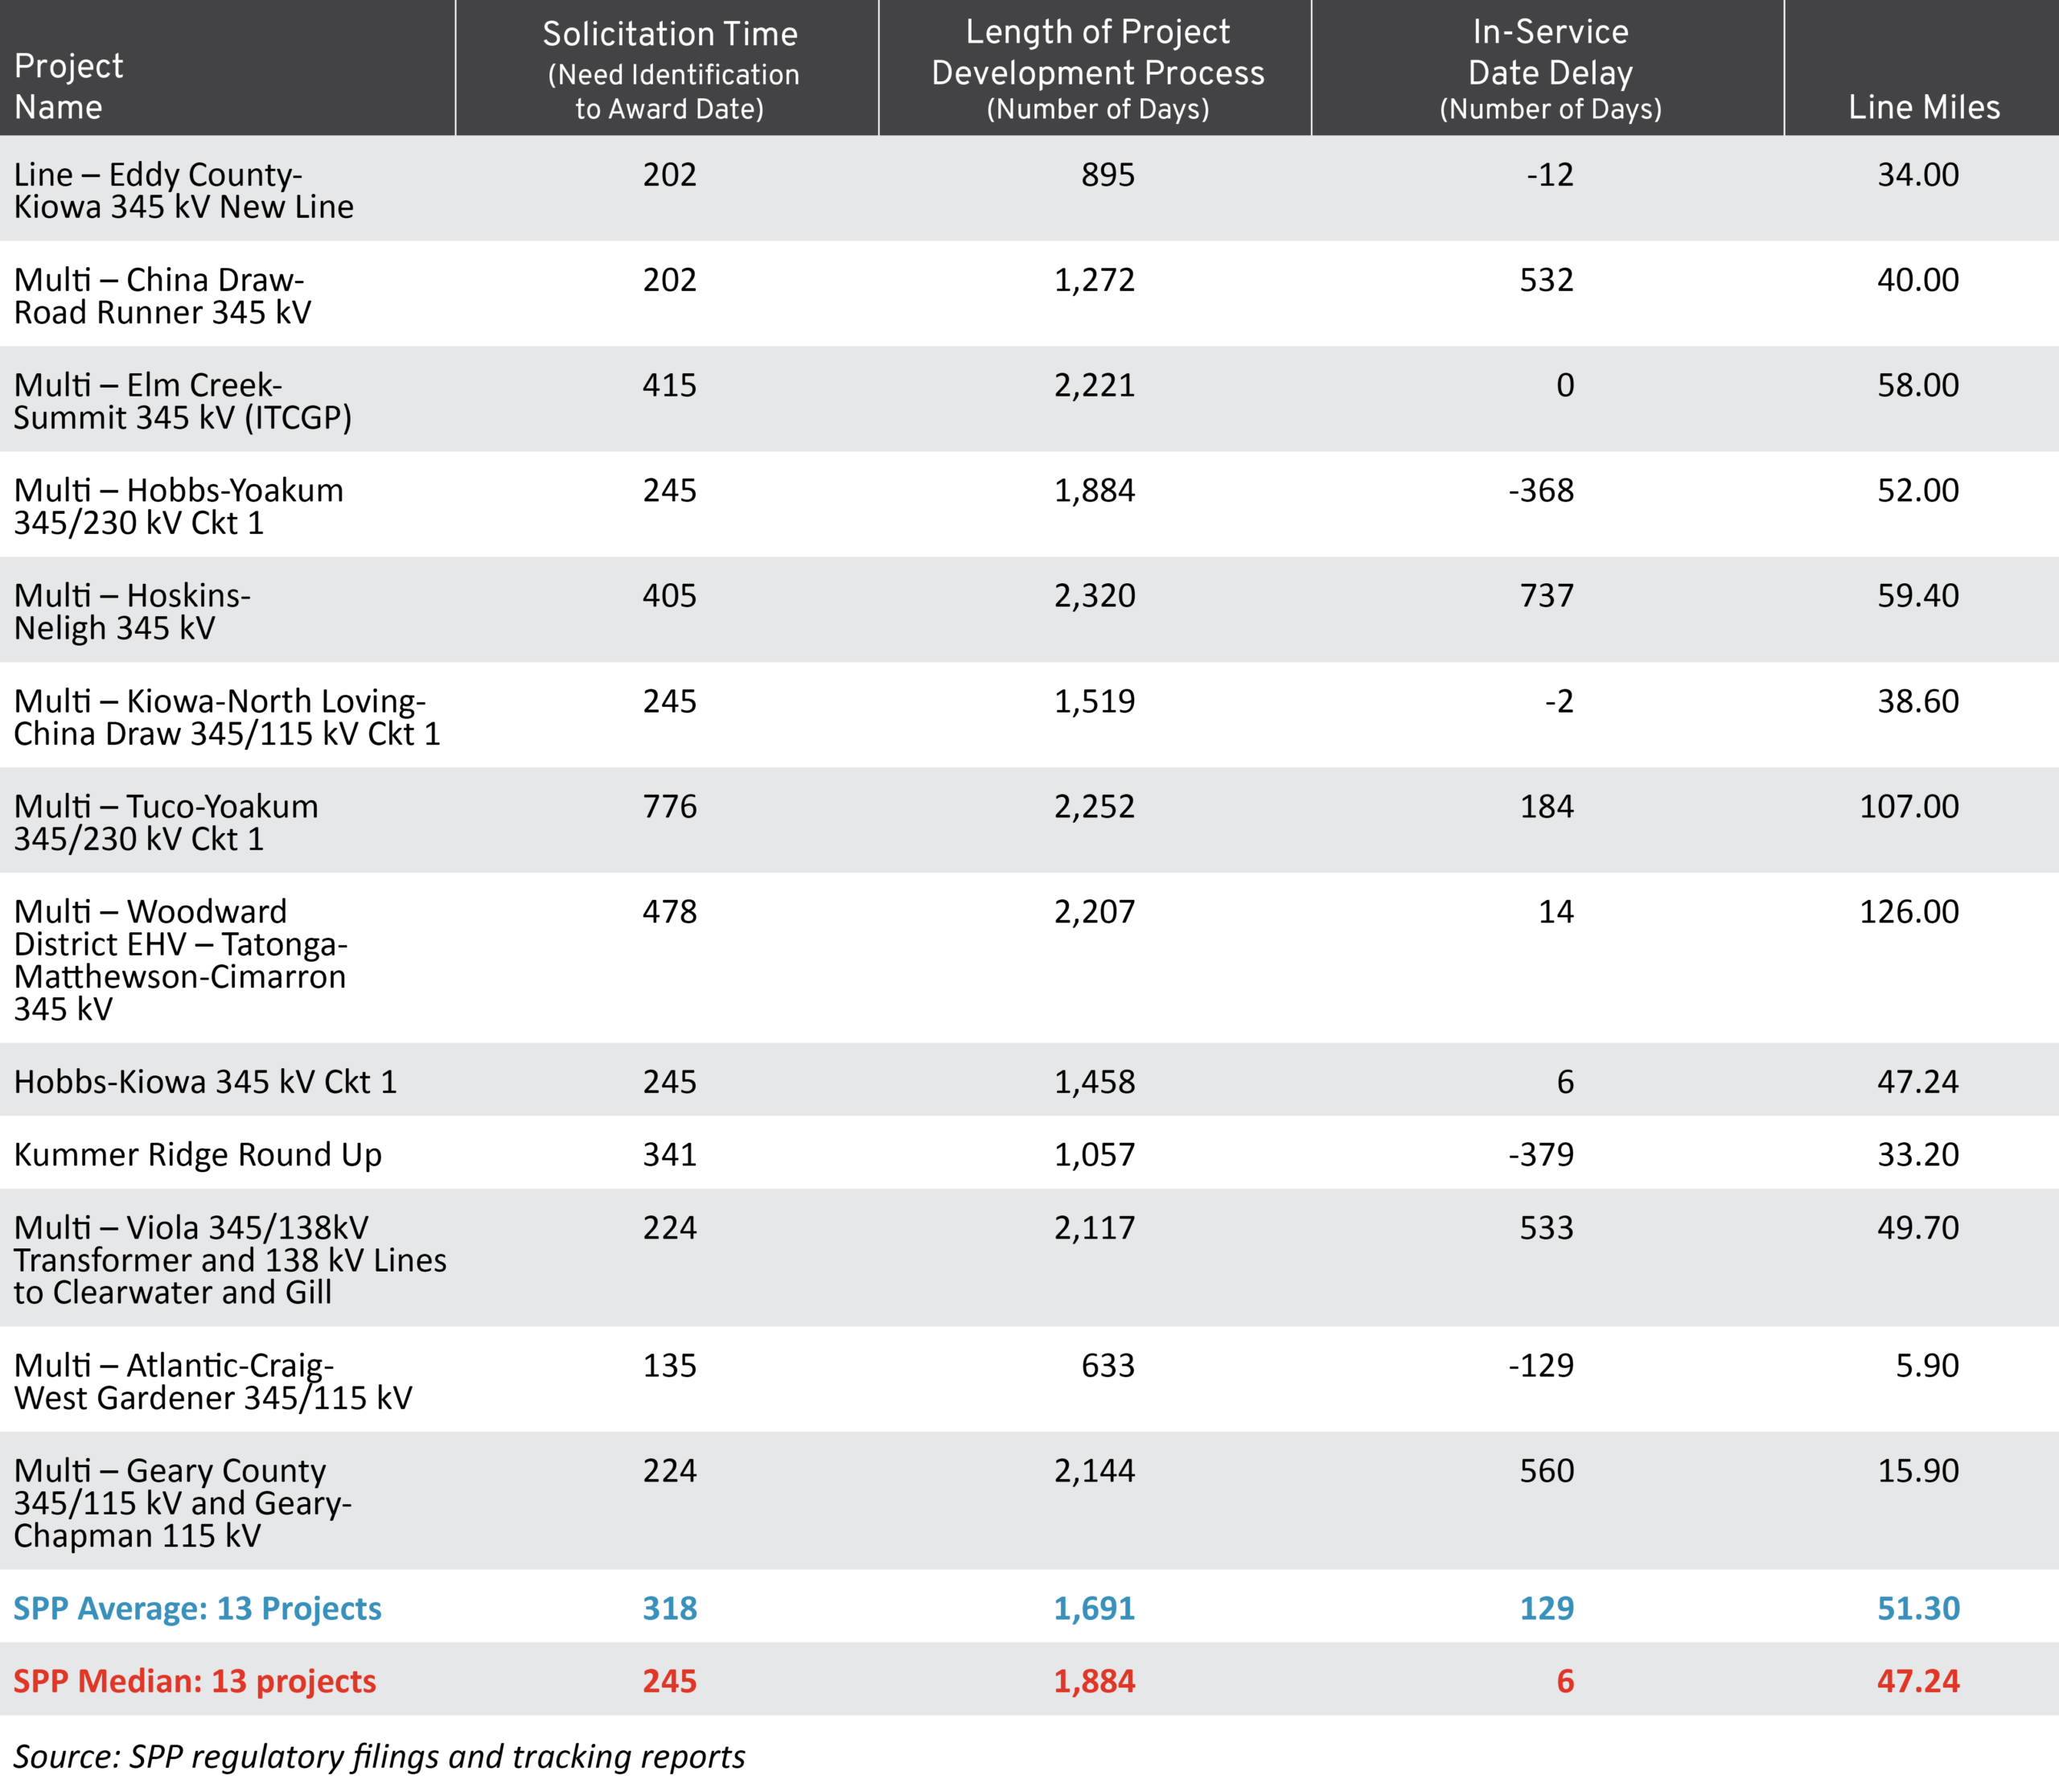
The incumbent sample in SPP includes 13 facilities that are in-service and that are exclusively or primarily transmission lines rather than substation projects and otherwise meet the data criteria previously set forth in this part of the series. Across these 13 projects, an average of 318 days passed between when the need for a project was accepted by SPP in the relevant study applicable to the project to when SPP issued notices to construct. Relevant to the two primary points of analysis in this part of the series, projects in the incumbent sample were an average of 129 days and a median of 6 days delayed or “late” as compared to an 80-day average and 98-day median for the four competitive projects that are either in or nearly in service. Furthermore, projects in the incumbent sample had an average of 1,691 days and a median of 1,884 days between when the project was accepted as needed by SPP and when it was placed into service as compared to the competitive average of 1,842 days and median of 1,825 days. The average length of the 13 incumbent projects within the sample assessed was 51 miles, with a median line length of 47 miles. The average project length for competitive projects was 88 miles, with a median of 84 miles.
Table 2 shows the incumbent transmission projects for SPP. The incumbent sample shows that non-competitive projects also experience meaningful schedule extensions and long development timelines. The data shows that competitive projects in SPP were developed within timelines comparable to incumbent projects despite the additional competitive solicitation process.
Table 2: SPP Incumbent Transmission Projects
Regional Analysis: MISO
Relevant to this timing analysis, MISO’s competitive solicitations follow the procurement model, where the RTO creates a MISO Transmission Expansion Plan (MTEP) to identify “expansions and/or enhancements to the MISO Transmission System.” If transmission facilities are identified as “Competitive Transmission Facilities” as part of the MTEP process, the RTO uses a competitive process to determine what entity will build, own, and operate it. MISO issues RFPs for competitive projects, and its business practice manuals permit the RTO to stagger the issuance of those proposals based on the RTO’s needs and prioritization. The RFP leads to a months-long solicitation during which qualified developers submit proposals. MISO then evaluates and scores the proposals and announces the winning developer and proposal.
MISO does an adequate job tracking the cost and timing of competitive projects with quarterly frequency, but information on older MTEP and competitive project selection reports are no longer available on the MISO website, including the relevant MTEP (2015) and the selection report from the Duff-Coleman solicitation described in the next section.
MISO projects in service
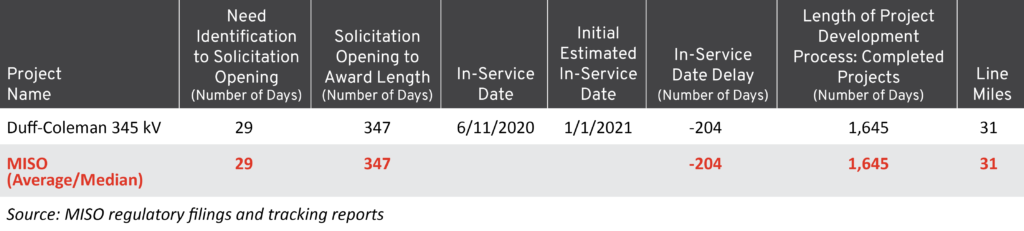
Duff-Coleman, the only competitive project in service in MISO, was identified as needed in the MTEP15 and approved by the board of directors in December 2015. A month after identifying the need for the project, MISO opened its competitive solicitation by issuing a RFP. The solicitation processes lasted 347 days until the selected developer was announced for the 31-mile-long project. Relevant to this part of our analysis, MISO’s comments in its selection report are as follows:
Republic Transmission excelled among a complement of strong proposals. Republic Transmission’s proposal provided the strongest combination of attributes, including but not limited to, the highest degree of certainty and specificity, the lowest risk, and low cost. In selecting Republic Transmission, MISO evaluated Republic Transmission’s proposal against four FERC-approved evaluation criteria: cost and design, project implementation, operations and maintenance, and planning participation. MISO was also guided and influenced by the collective application of the four evaluation principles found in MISO’s business practices manual: specificity, certainty, cost, and risk mitigation.
While Duff-Coleman’s initial expected in-service date was Jan. 1, 2021, the project was actually placed into service June 11, 2020—204 days earlier than scheduled—bringing the total time of the project from identification of need to being placed into service at 1,645 days as compared to the expected period of 1,849 days.
Although MISO currently has only one completed competitive transmission project available for analysis, the Duff-Coleman project still provides a useful comparison point. The project was completed ahead of schedule and within a total development timeline that compares to incumbent MISO projects, suggesting that the competitive solicitation process did not impede project delivery.
Table 3 summarizes key milestones in the development timeline for the Duff-Coleman project, including the time between identification of need and solicitation opening, the duration of the competitive solicitation process, projected and actual in-service dates, and the total project development timeline.
Table 3: MISO Competitive Transmission Project
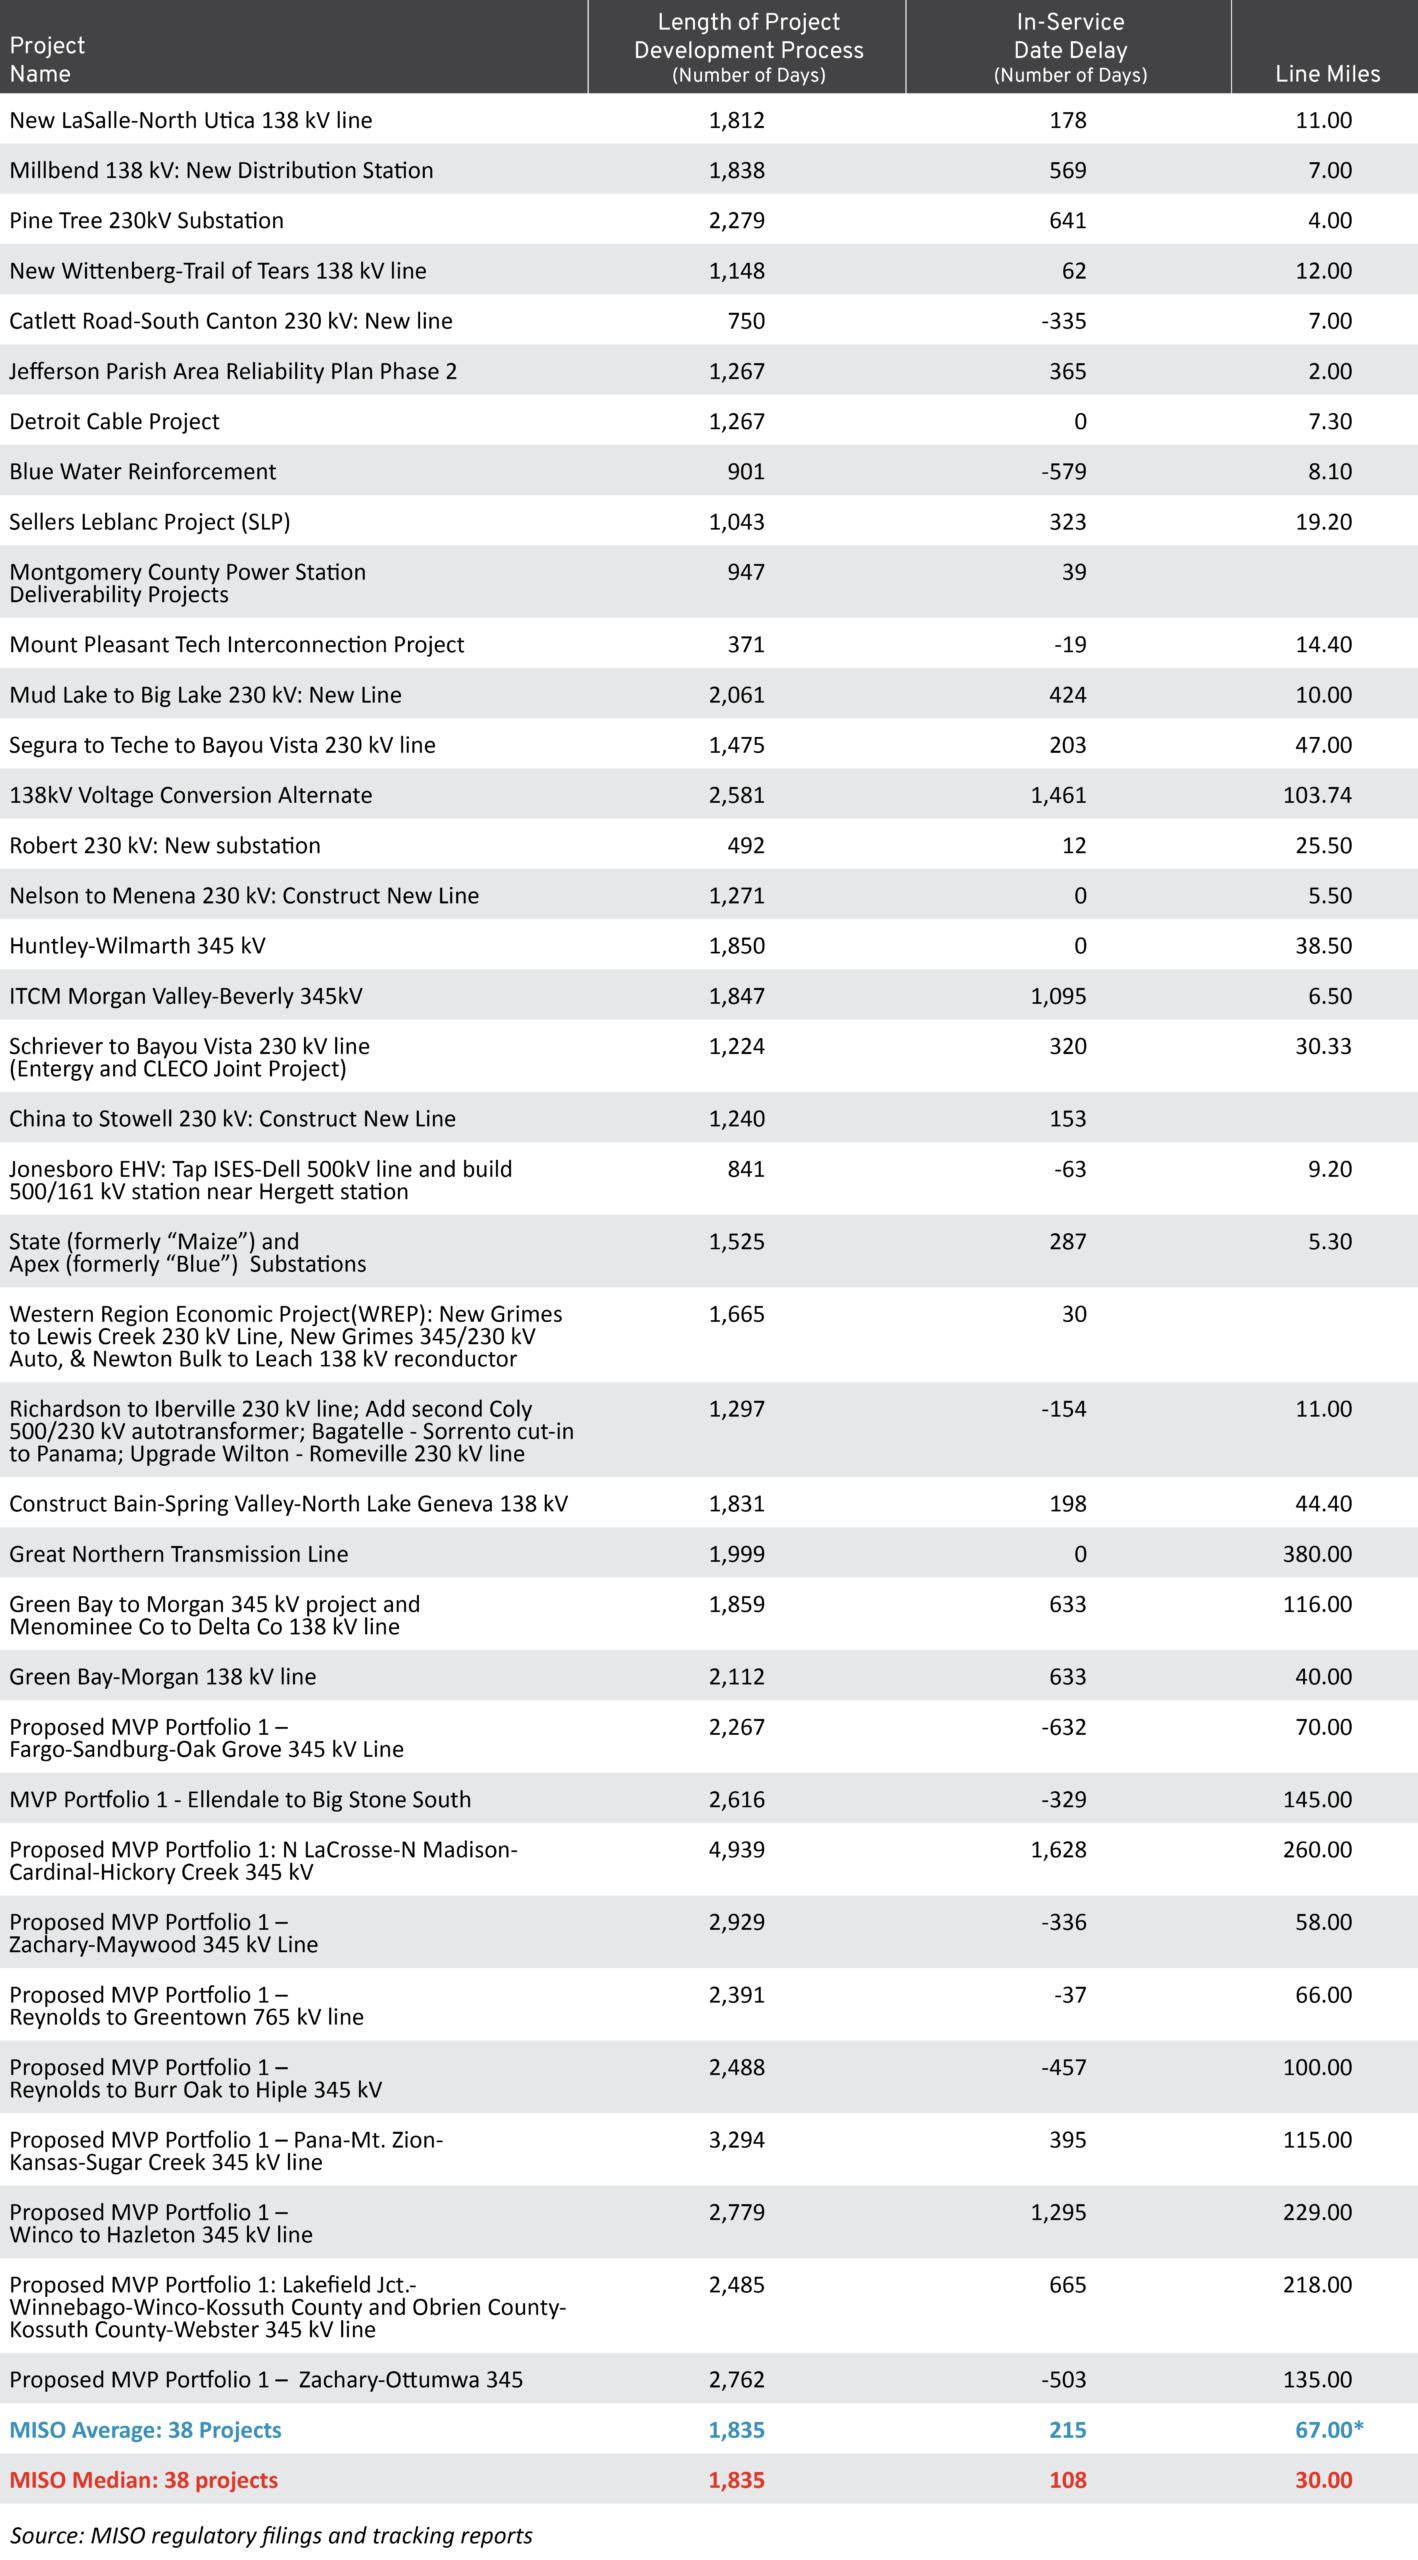
The incumbent sample in MISO includes 38 projects that are exclusively or primarily lines and that otherwise meet the selection criteria previously explained. For incumbent projects in MISO, our total timeline calculations also begin when the project is included in the relevant, board-approved MTEP, although there is no measure between “need” and “award” date in MISO like there is in SPP. The incumbent sample in MISO were delayed or “late” by an average of 215 days with a median delay of 108 days as compared to the competitive project in MISO, which was 204 days early. The average time for the incumbent sample to be placed into service after board approval was 1,835.3 days (rounded to 1,835 days), with a median of 1,834.5 days (rounded to 1,835 days). This is nearly 200 days longer than the competitive experience, but similar to the expected timeline of the Duff-Coleman project. Notably, the incumbent project sample appears to have faster timelines than MISO had previously observed for other incumbent regional transmission projects. For instance, MISO noted in its MTEP15 report:
The MTEP14 Appendix A projects have, on average, adjusted their in-service date back by 13 months. In the MTEP14 report, the average in-service delay for a similar subset of projects was 16 months. Little or no impact on reliability is expected from the adjusted in-service dates. Transmission Owners may adjust project in-service dates to match system needs.
Table 4 shows the wide variation in timing performance across incumbent transmission projects in MISO. Several projects experienced substantial schedule extensions, while others were completed ahead of schedule. The data reinforces that delays occur across all transmission development models, as transmission development timelines are highly project-specific and influenced by a wide range of operational and regulatory factors beyond the presence or absence of competition.
Table 4: MISO Incumbent Transmission Projects
* Note: MISO line miles available for 35 of 38 incumbent projects
Regional Analysis: PJM
Differently from MISO and SPP, PJM conducts transmission competition under the sponsorship model. As described by PJM:
When needs are identified, PJM opens competitive planning “windows” so that transmission owners and other developers can submit solutions they’ve designed. If a solution is selected and approved by the PJM Board of Managers, the developer will, as appropriate, seek siting approval for, construct and maintain the substations and transmission lines included in its proposal.
As indicated in the results of the following analysis, PJM is the only RTO/ISO where incumbent projects are placed into service faster than competitive projects over comparable planning and development processes. Relatedly, four of the six projects in our competitive sample in PJM were awarded to incumbent utilities. Relevant to the observations, PJM’s project tracker collects lower-quality data than trackers in other regions. This is due to a number of factors: Developers provide PJM’s data, which is not independently verified, has no vintage details, and can become stagnant from a lack of updates.
PJM projects in service
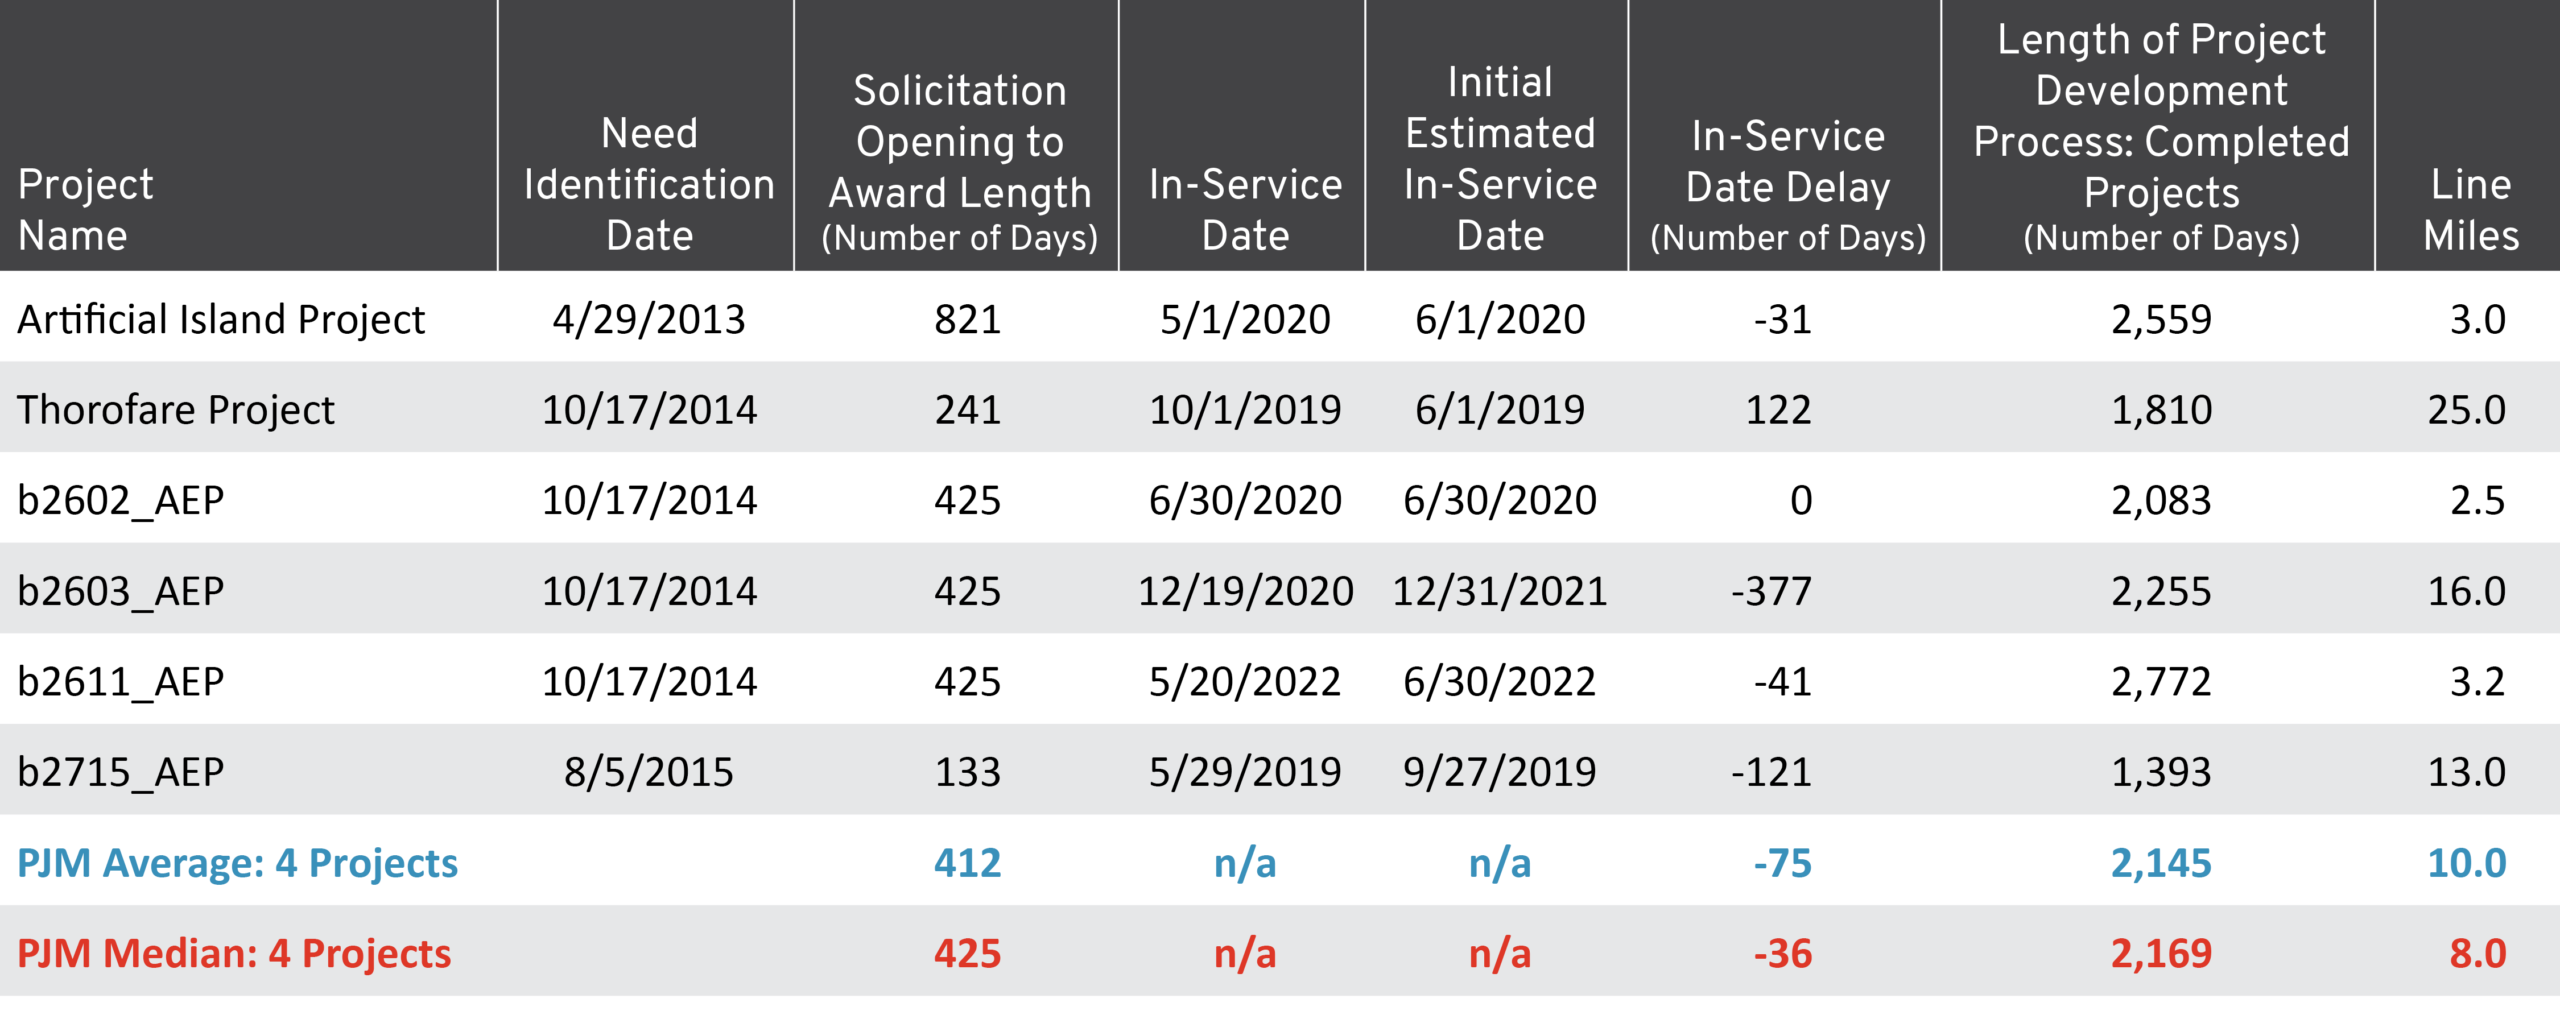
For our competitive project sample in PJM, we identified the six greenfield projects that are in service and went through the RTO’s competitive process. Our calculation for total planning and development time started when PJM published the need, seeking responses with solutions. The solicitation period used in other regions is similar to the competitive “window” PJM used to receive and judge projects, and the end of that measurement period in PJM is marked in our data by the approval of the project by the PJM board of managers. The average total time for the competitive project sample in PJM to be placed into service after identifying the need for any project is 2,145 days, with a median of 2,169 days. In the aggregate, these competitive projects were not delayed; instead, they came in an average of 75 days (with a median of 36) before their initial expected in-service dates.
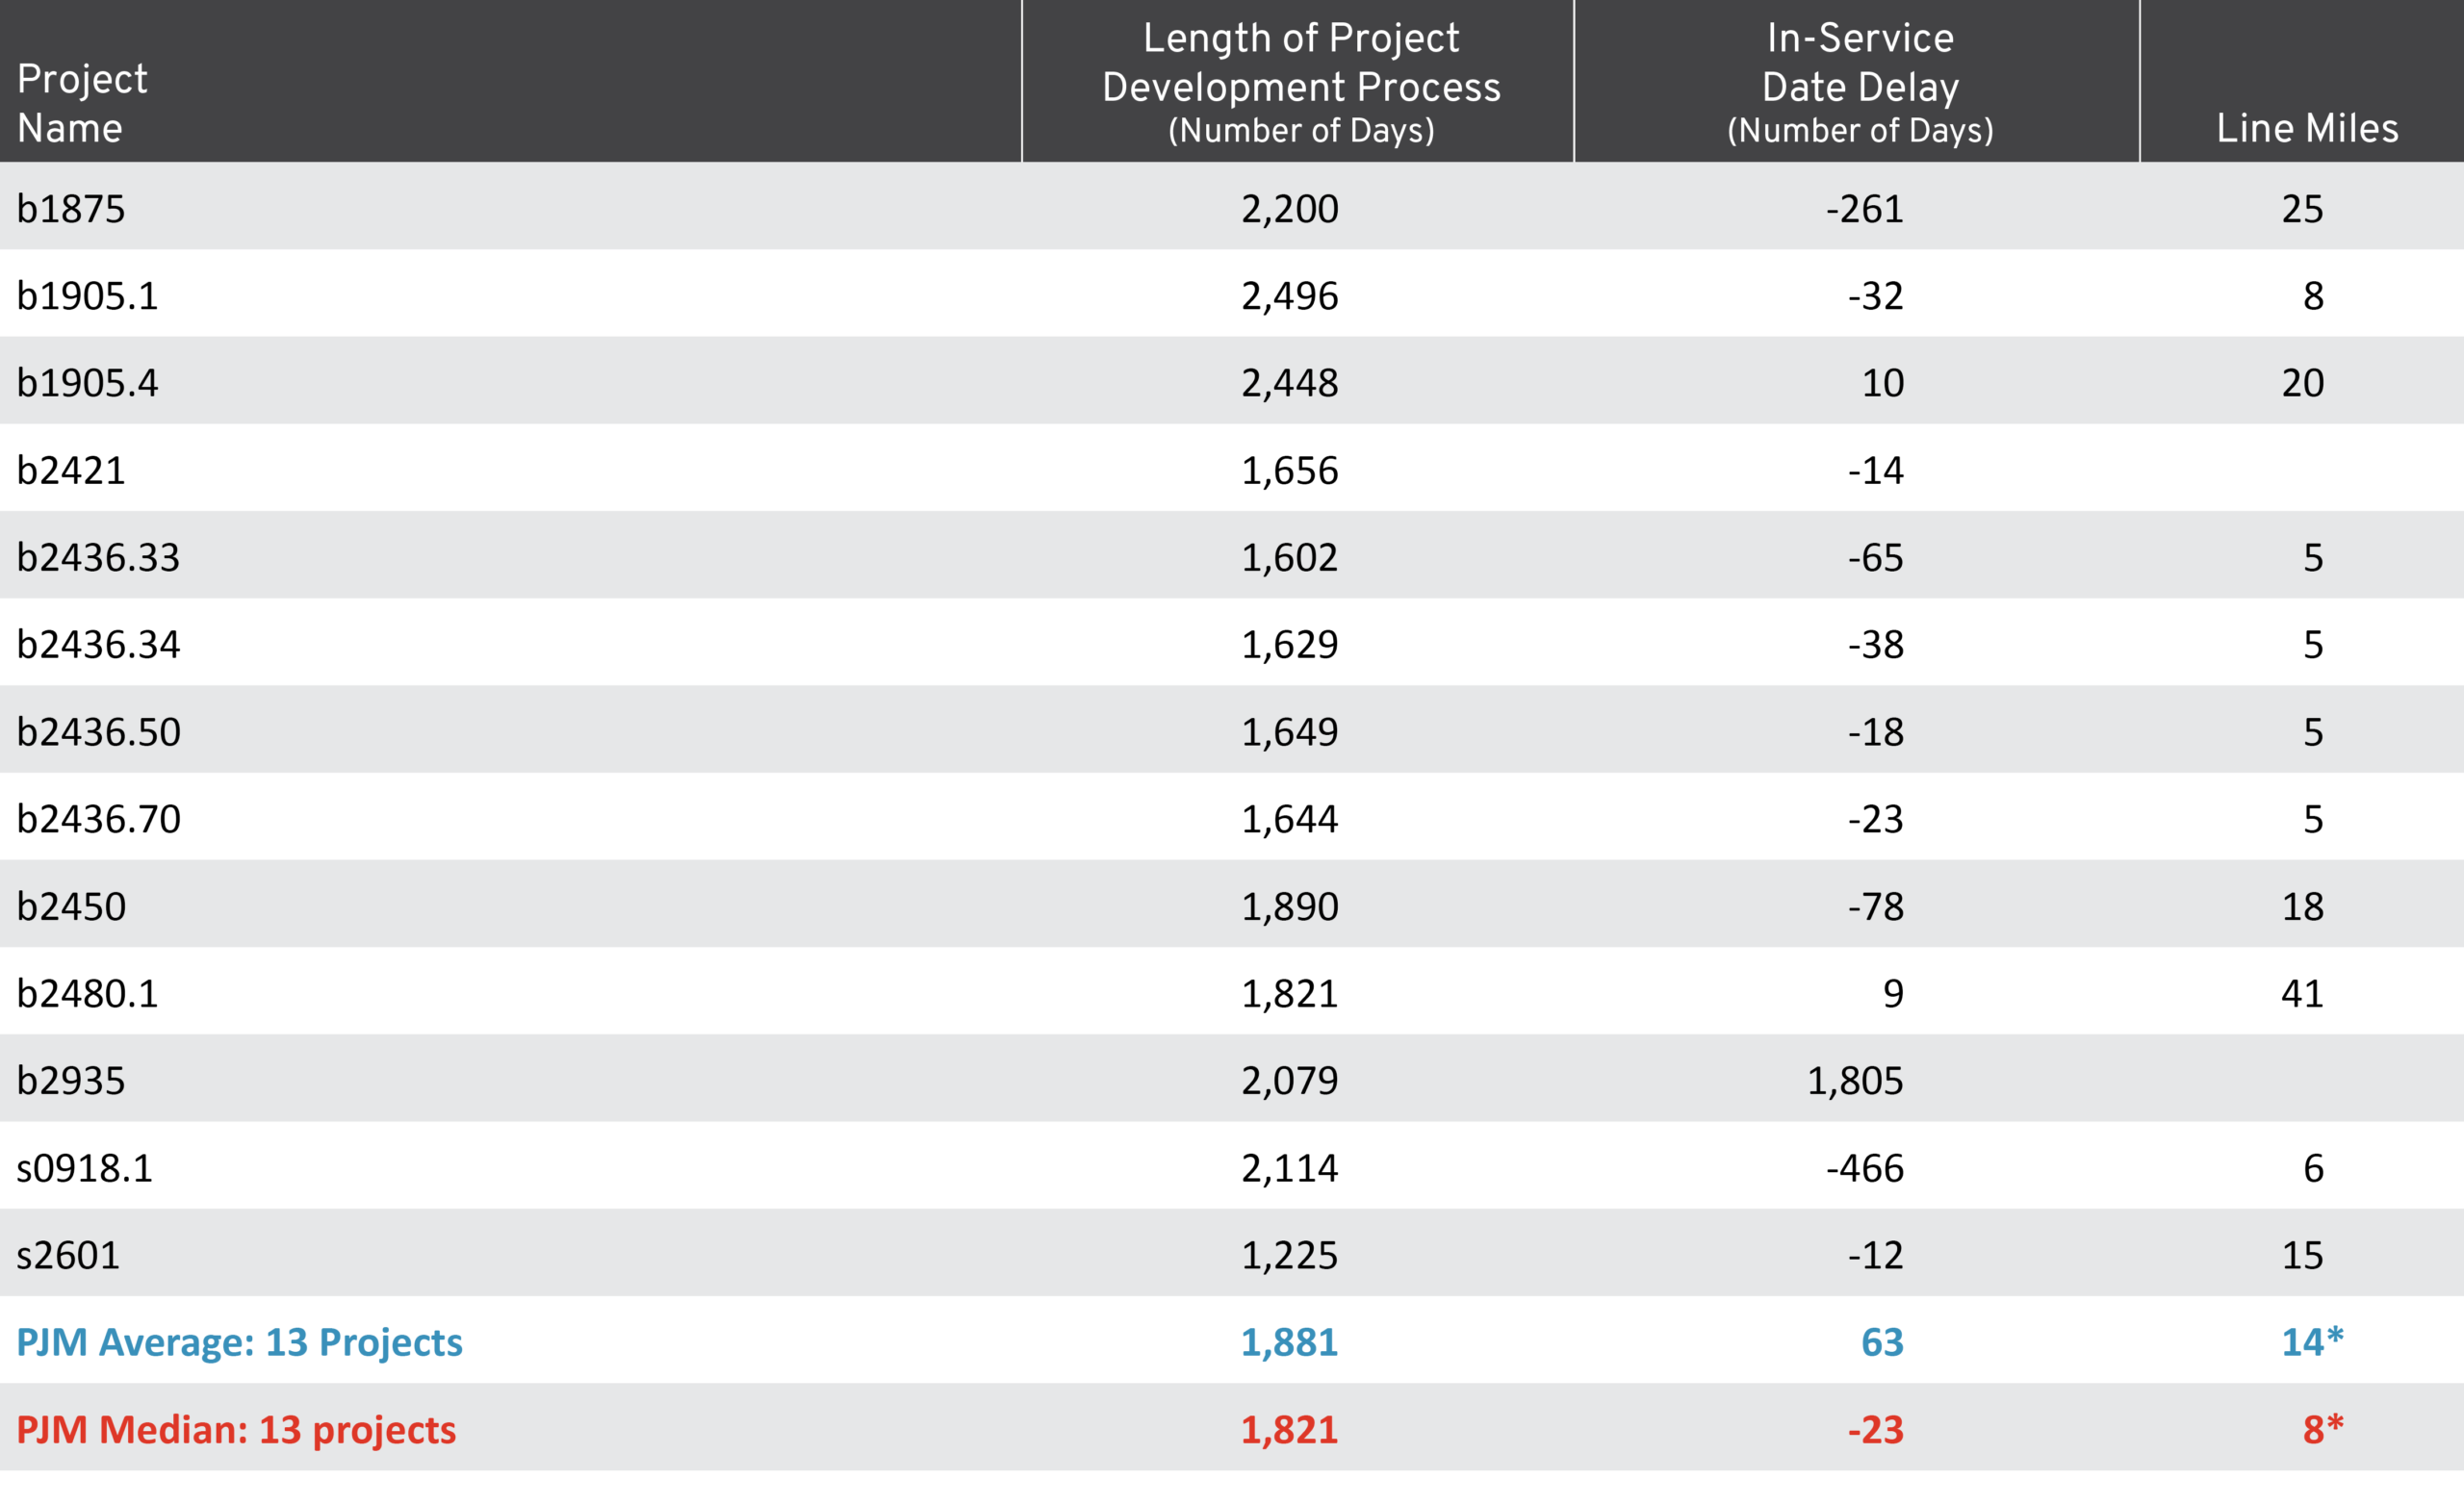
Our incumbent sample in PJM includes 13 greenfield or rebuild projects that are primarily lines rather than substations, along with the selection criteria previously noted. Of that sample, our analysis started with need identification, taken from the initial presentation of need by the utility at either the attachment M3 local transmission stakeholder meeting or the meeting of the transmission expansion advisory committee. While utility-identified need is generally the best data point available to begin the calculation in PJM, there are notable examples of utilities in the region delaying the identification of need—sometimes not publicly acknowledging it until the solution is placed into service. Although we identified initial estimated in-service dates from PJM’s live project tracker (which remains editable by transmission owners on an ongoing basis), there are concerns with data vintage in that if in-service estimates change, the initial dates disappear from the tracker. With these constraints in mind, and given the available data, we identified the average length of projects in the incumbent sample as 1,881 days, with a median of 1,821 days. The average delay for the incumbent sample was 63 days, with a median of 23 days early.
Regional Analysis: NYISO
NYISO conducts a competitive transmission development process to meet the state’s public policy requirements in the most cost-effective way. Similar to PJM, NYISO aggregates the state’s needs in conjunction with the New York Public Service Commission and seeks sponsored transmission solutions to those needs from interested developers. After reviewing sponsored proposals, the NYISO board of directors may choose one or more proposals that efficiently or cost-effectively meet the previously identified needs.
NYISO projects in service
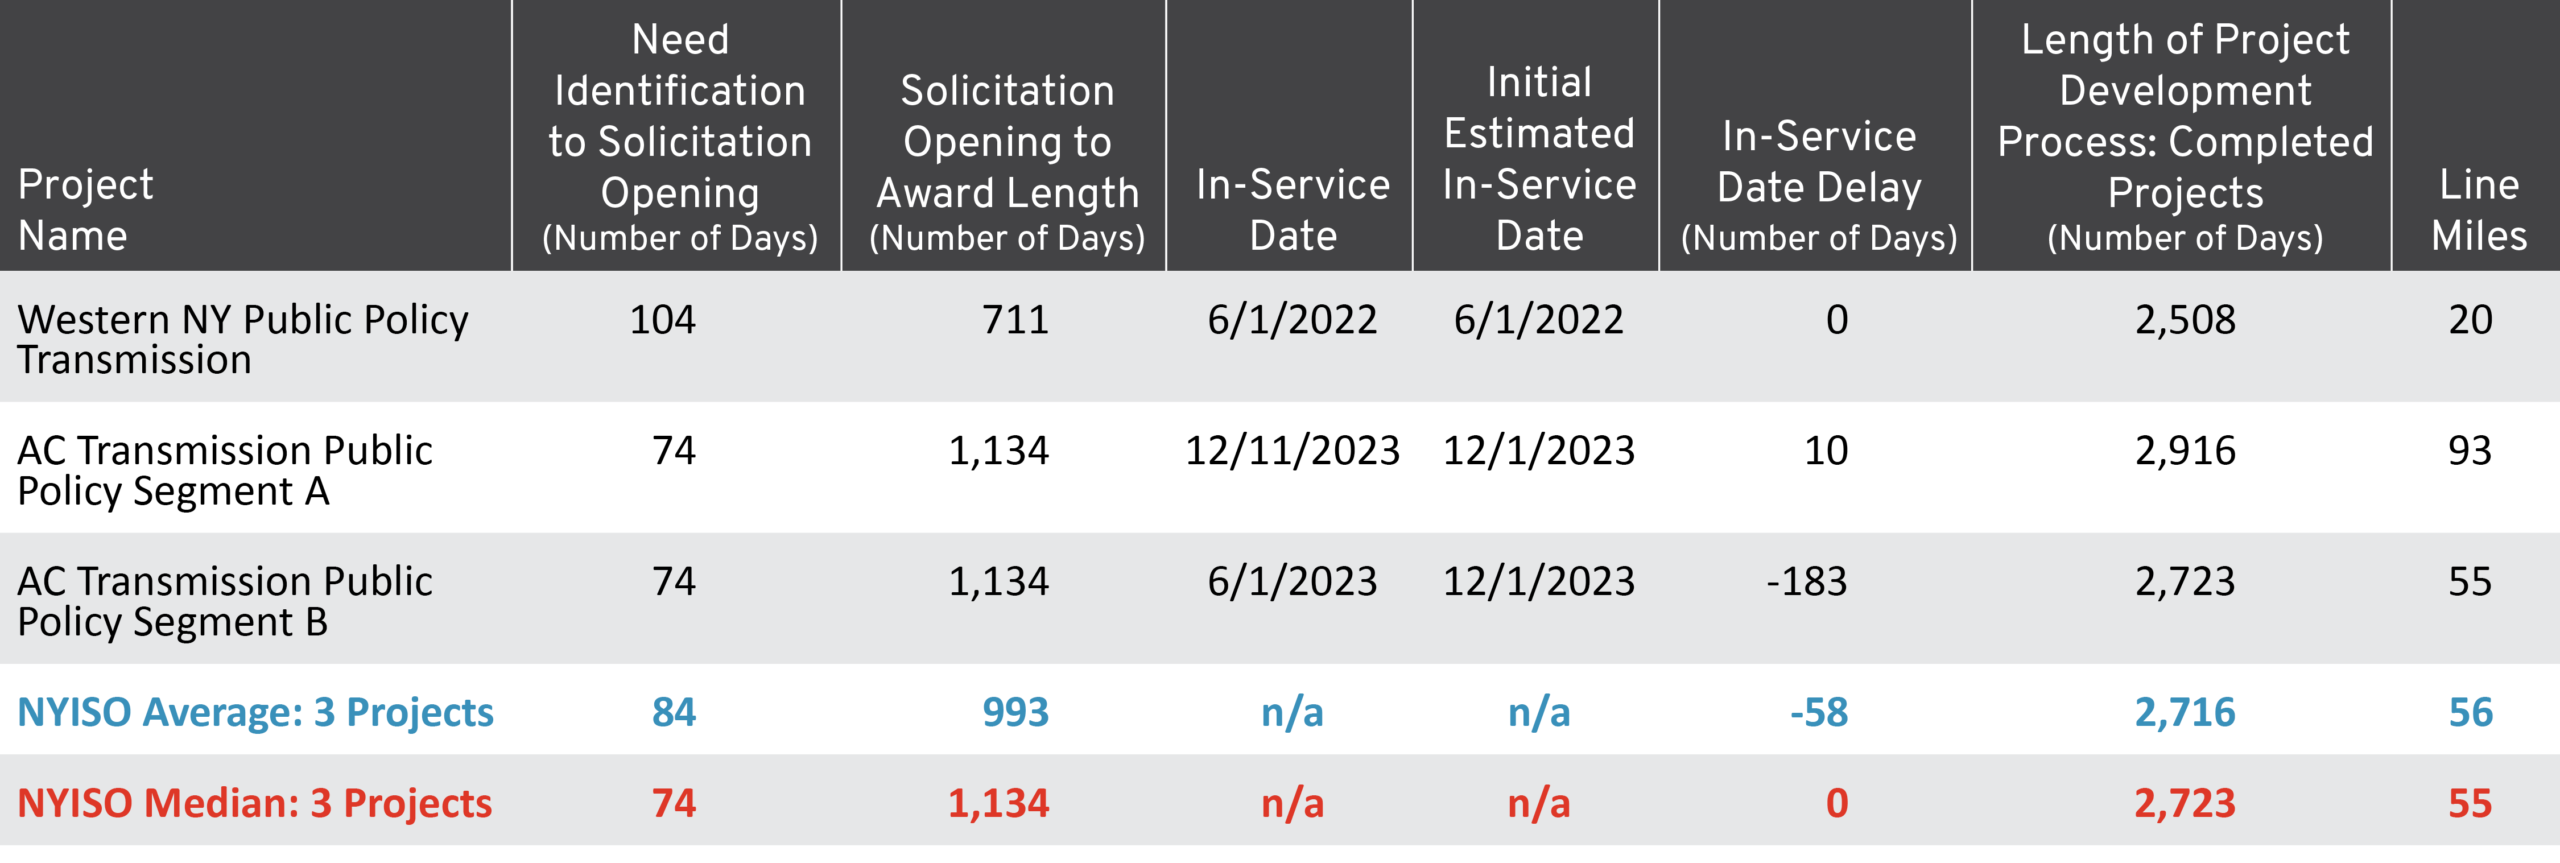
NYISO has three competitive projects with facilities in service since 2022 or 2023. For our analysis, we begin our timeline calculations at the point where the New York Public Service Commission identifies and approves the Public Policy Transmission Planning needs and end when the projects are placed into service. We also measured and analyzed the time it takes between identification of needs and the NYISO board of directors’ approval of projects to meet those needs. On average, it took 2,716 days between need identification and the competitive transmission solution’s in-service date, with a median of 2,723 days. The projects were placed into service an average of 58 days before the expected in-service date, with a median delay of 0 days.
NYISO has not historically required public reporting and tracking of large incumbent transmission projects; therefore, the authors did not have data to analyze any incumbent projects in the planning region that fit our selection criteria.
Regional Analysis: CAISO
CAISO follows the procurement model, where the ISO identifies solutions to transmission needs and subsequently seeks developer proposals to build, own, and operate those facilities. As part of CAISO’s effort to produce its transmission plan, it identifies and aggregates transmission needs that it will later identify solutions to address. After identifying solutions, the ISO will identify which of those projects are available for inclusion in subsequent competitive solicitations and provide sufficient information for interested developers to submit proposals to build the facility.
CAISO projects in service
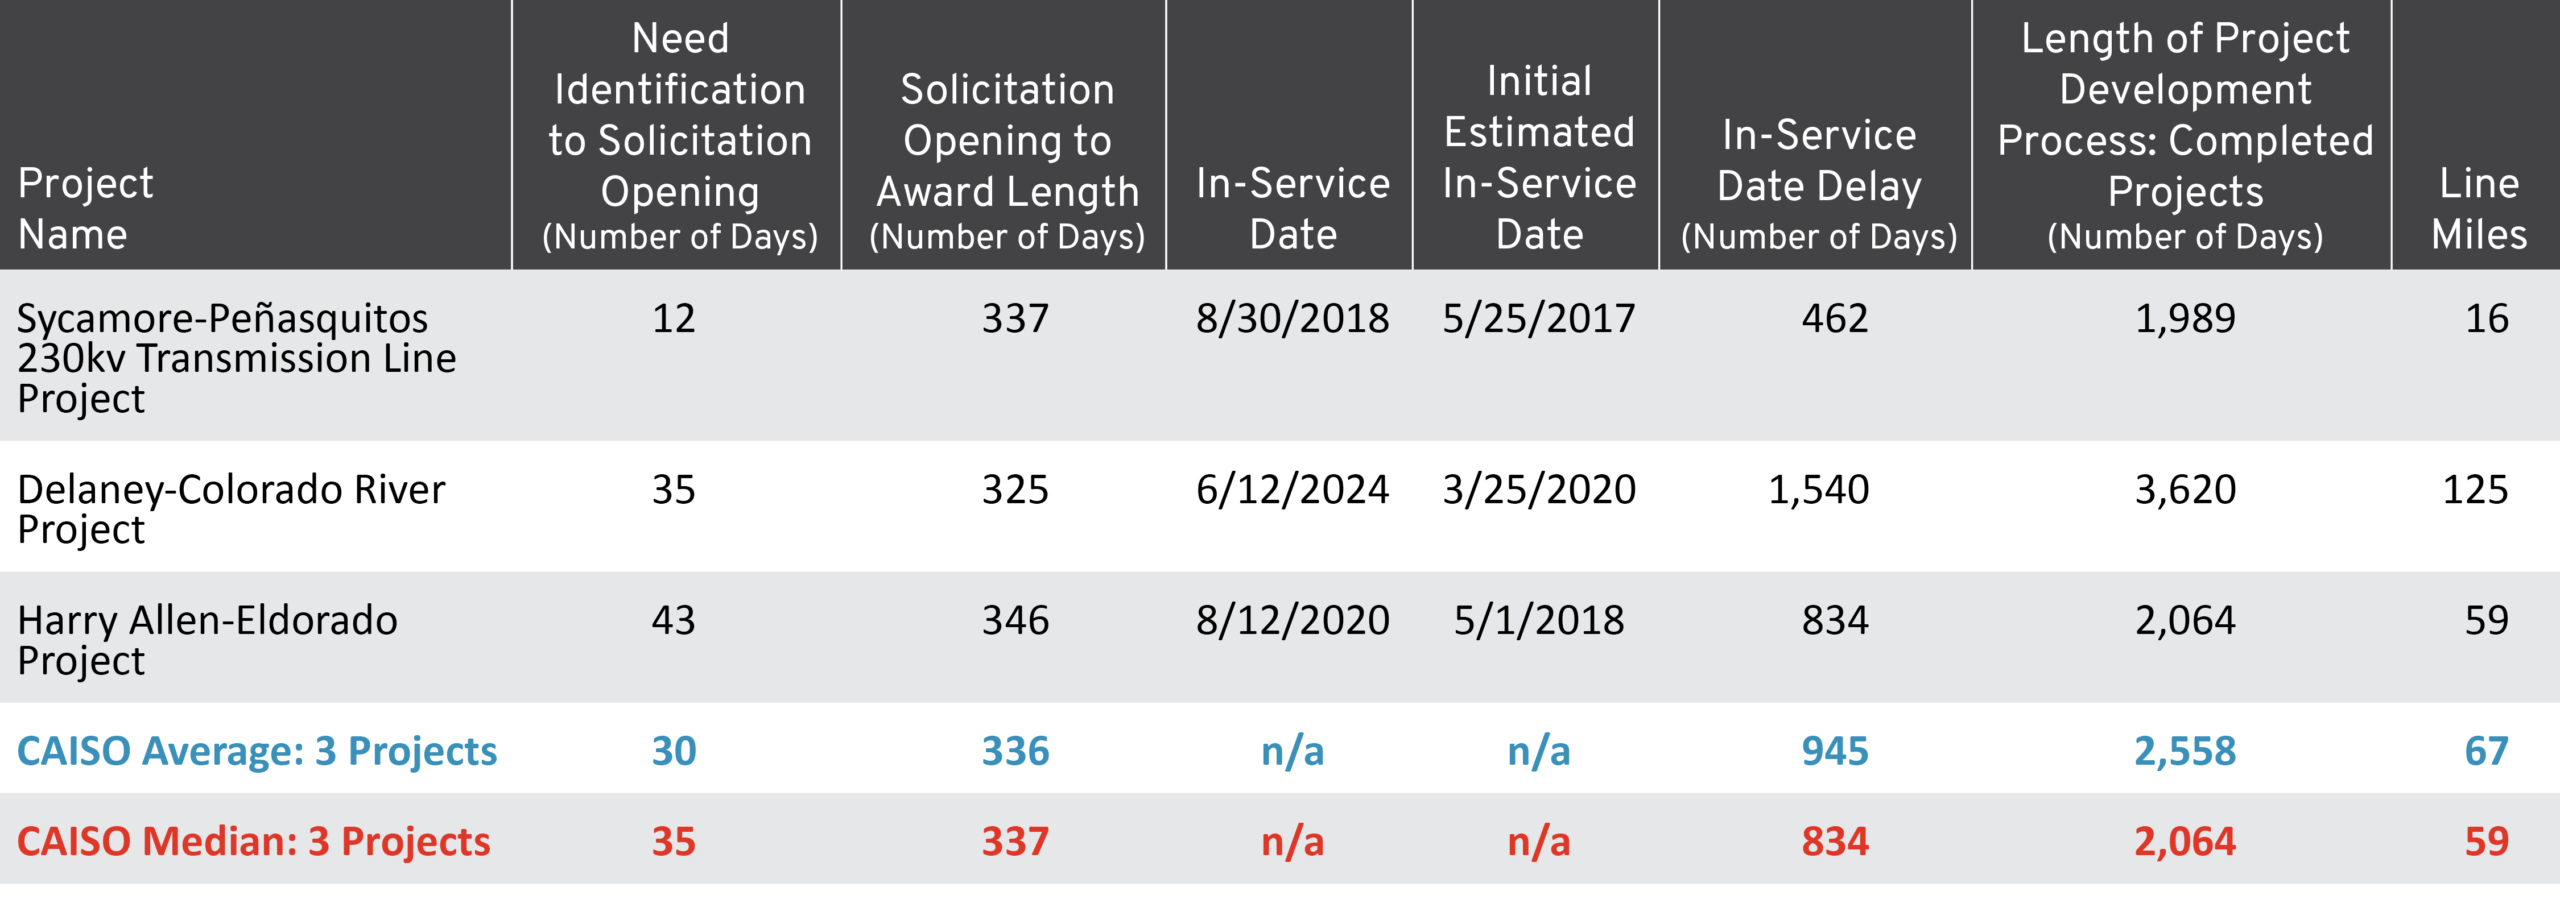
CAISO has three lines-only competitive transmission projects in service. The authors have data for substation-only competitive projects that are not included in this case study for reasons of brevity but are included in the table of data. For determining the time it takes to plan and develop competitive lines in CAISO, we used the ISO’s posting of its reliability study results as the starting point or proxy for need identification. The average time it took CAISO’s three lines-only competitive projects to be placed into service after need identification was 2,558 days, with a median of 2,064 days. The average delay for those projects was 945 days, with a median of 834 days. While the competitive transmission delays in CAISO are more severe than in other regions, they are comparable with incumbent project results, indicating CAISO-specific drivers that could benefit from additional analysis.
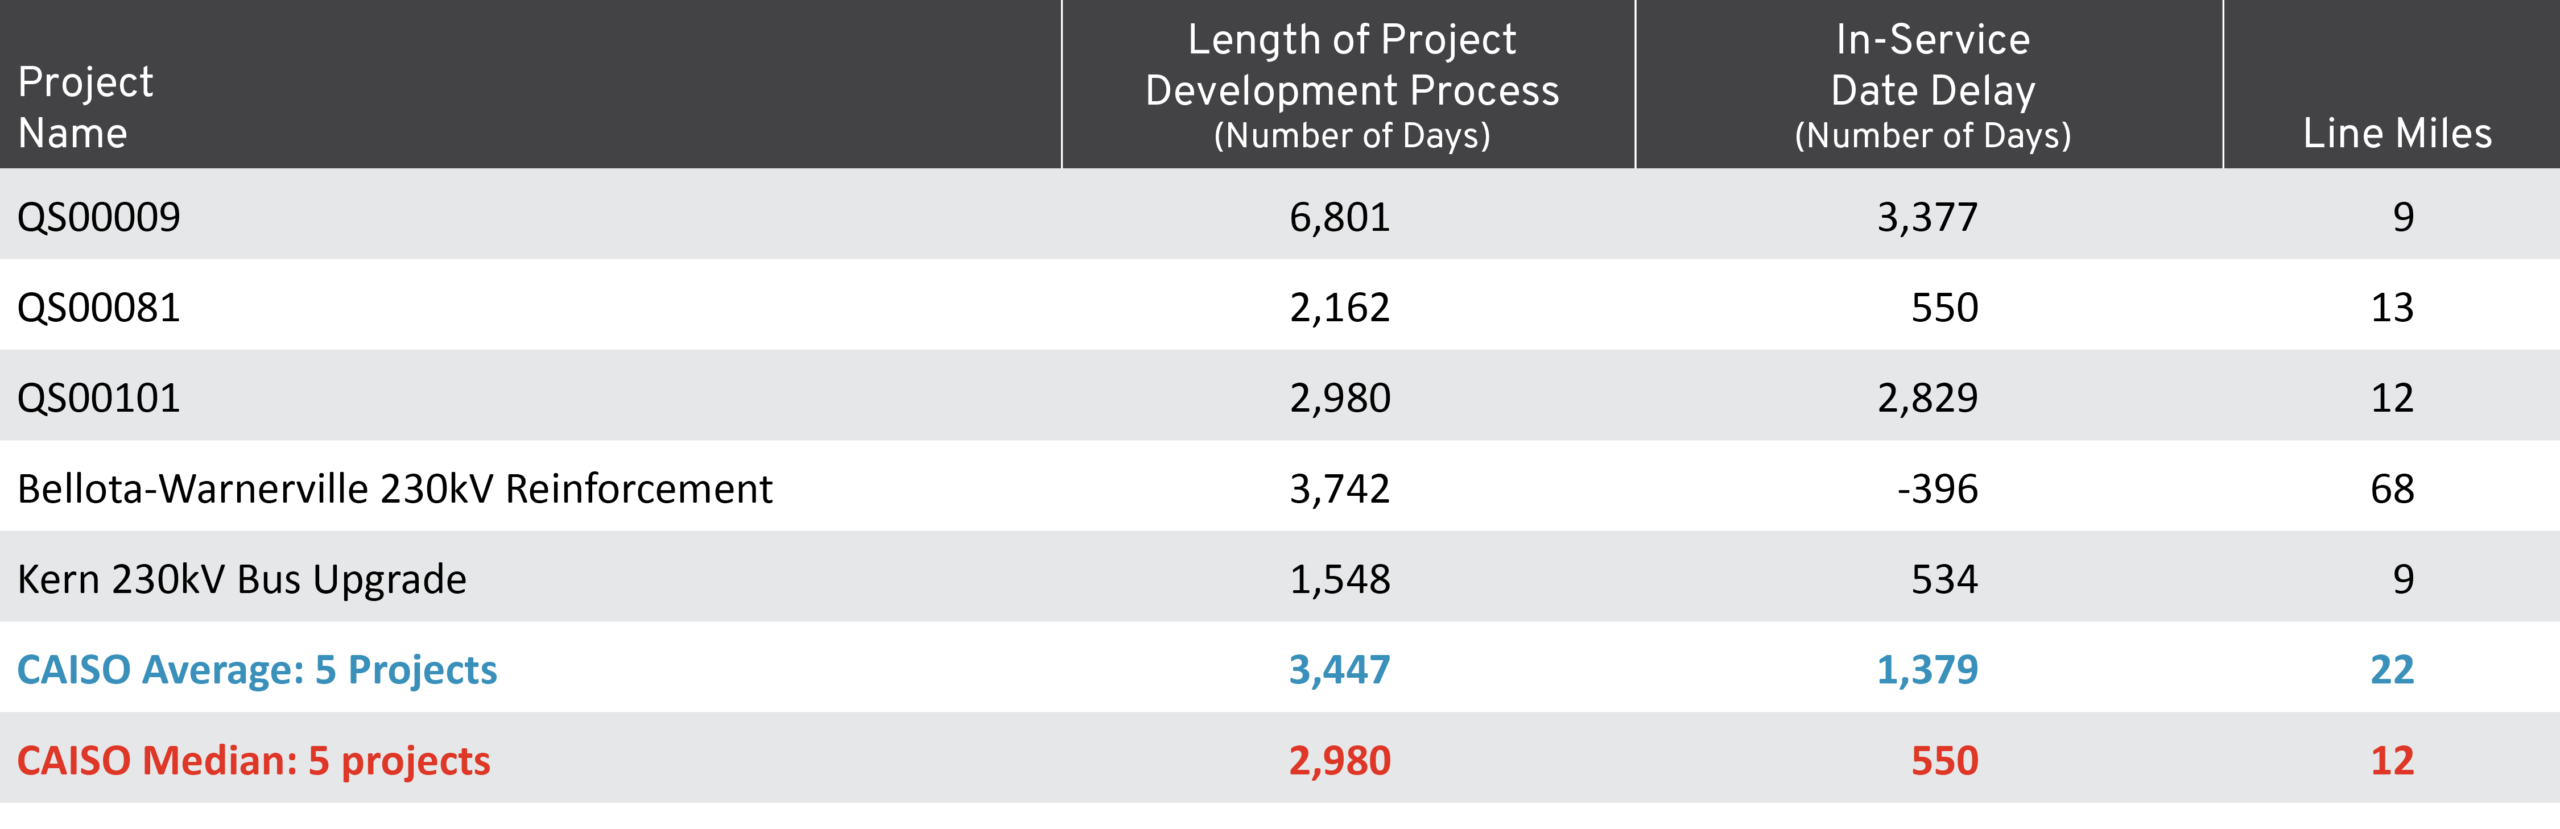
The authors also analyzed a sample of five line-only greenfield or rebuild incumbent projects. The authors have data for substation-only incumbent projects that will not be included in this case study for reasons of brevity; however, relevant data points will be included in tables. In calculating the timing aspect of the incumbent sample, our analysis assumed the need for the project arose in the year it was included in the incumbent utility’s Long-Term Transmission Investment Plan as provided through the California Public Utilities Commission’s Transmission Project Review process. These incumbent projects in CAISO took 3,447 days on average to complete, with a median timeline of 2,980 days. The average delay for the five projects was 1,379 days, with a median delay of 550 days.
Regional Analysis: ISO-NE
ISO-NE uses the sponsorship model to conduct competitive transmission, and it has successfully placed one competitive project in service to date. After conducting a needs assessment, ISO-NE determines whether the needs are far enough in the future to be alleviated via transmission built, owned, and operated under a “competitive solution process.” If needs exist that should be subject to the competitive process, an RFP is issued and qualified prospective developers can submit solutions to the identified needs. The ISO then selects preferred solutions and notifies the chosen developer(s).
ISO-NE projects in service
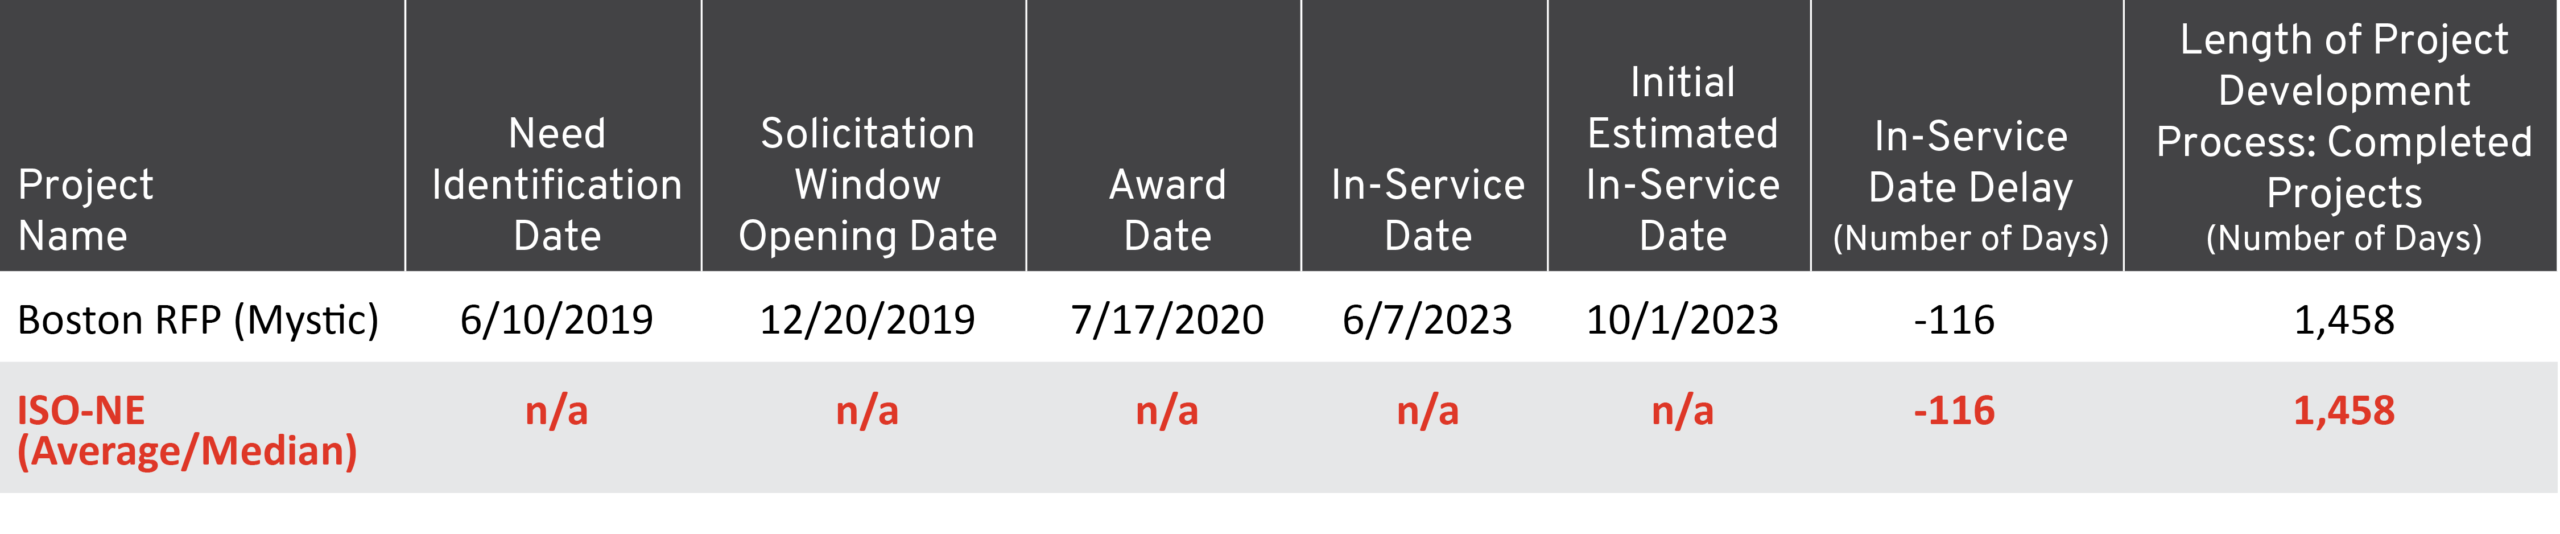
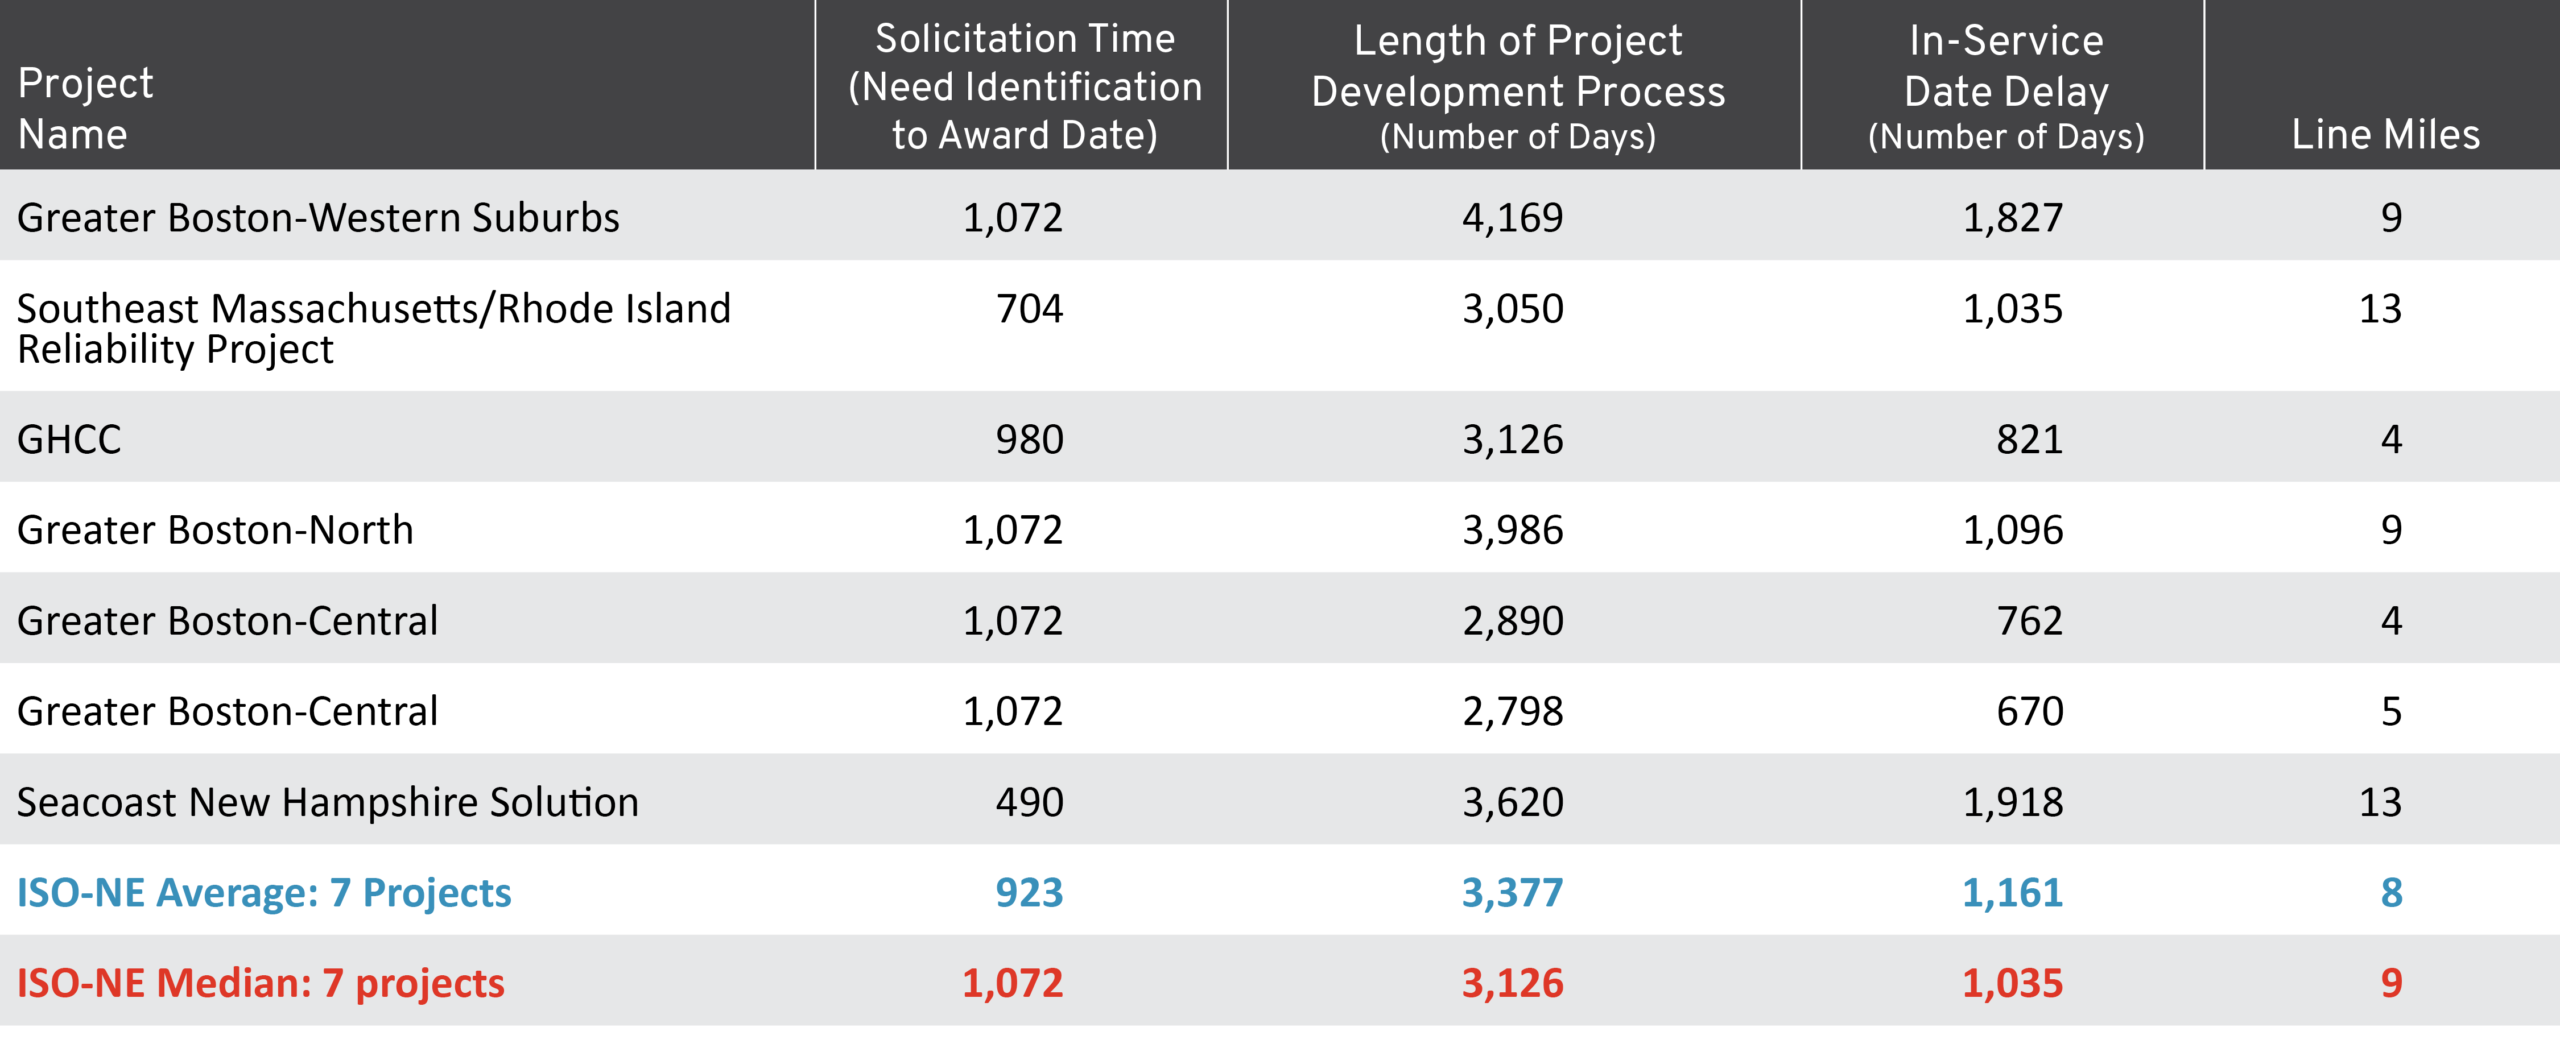
The one competitive project in service in ISO-NE, the Boston 2028 RFP project, was placed into service in 2023. The need for a solution to that project was identified in 2019, and the time between need identification and its in-service date was 1,458 days—116 days earlier than initially estimated. The solicitation period for the project (i.e., the time after the RFP for solutions was issued and the project was ultimately selected) lasted 210 days.
The incumbent sample for ISO-NE includes seven lines-only projects. For the purposes of our assessment, the starting point for determining the timeline of the projects is the same: the needs assessment release date that drove each project. Further, our analysis sourced initial in-service estimates from tracker data and identified the actual in-service date using post-in-service tracker updates. These seven projects took an average of 3,377 days to be placed into service after their need was identified, with a median length of 3,126 days. These seven projects were delayed an average of 1,161 days relative to their initial estimated in-service dates, with a median delay of 1,035 days.
Conclusion
While competitive solicitations take time to conduct—more than a year, in some instances—they do not delay needed transmission. Even taking into account the solicitation processes, competitive transmission planning and development timelines are consistent with incumbent timelines, and in many regions the competitive projects in service today were put into service faster than utility-developed transmission projects. If the length of competitive solicitations is a concern for policymakers, they should focus on changes or amendments to those processes to speed them along. If the length of solicitations is reduced, competitive projects would have an even greater advantage over incumbent developed transmission projects. However, transmission development delays are consistent between competitive and incumbent projects and across regions, indicating industry-wide factors that could benefit from further analysis.
Appendix
The appendix includes detailed timing metrics for all transmission projects across the remaining ISOs, based on available data.
Appendix Table 1: NYISO Competitive Transmission Projects
Appendix Table 2: NYISO Incumbent Transmission Projects
No comparable incumbent sample was available for NYISO
Appendix Table 3: CAISO Competitive Transmission Projects
Appendix Table 4: CAISO Incumbent Transmission Projects
Appendix Table 5: PJM Competitive Transmission Projects
Appendix Table 6: PJM Incumbent Transmission Projects
* Note: PJM Line Miles are available for 11 projects out of 13 incumbent projects
Appendix Table 7: ISO-NE Competitive Transmission Projects
Appendix Table 8: ISO-NE Incumbent Transmission Projects
Next in this series: Part 3—Cost