
Need for Speed: An Analysis of Speed to Market and Cost Results of Competitive Transmission
Over a decade ago, federal regulators overhauled the way transmission planning is conducted in the United States. As part of those changes, the Federal Energy Regulatory Commission (FERC) determined it would no longer allow incumbent utilities to possess a right of first refusal (ROFR) to build all transmission traversing their state-determined service territories. Instead, certain significant regional transmission lines would be subject to competitive solicitations in which both incumbent and non-incumbent developers could submit proposals for inclusion in the regional transmission plan. This competition is notably different from merchant transmission, which recovers revenue from market prices or willing off-takers rather than through regulated rates. In order to determine the efficacy of FERC Order 1000’s removal of utilities’ federal ROFR to build transmission, R Street analyzed the length of time it takes to plan and develop competitive transmission. R Street’s analysis sought to compare competitive projects’ final results with the appropriate counterfactual: similar incumbent-developed transmission lines. While FERC’s initial rule opening up transmission development to competition was decided a decade and a half ago, most transmission planning regions have only seen a handful of competitive projects placed into service.
Data Quality
In addition to having few competitive project results to compare, R Street found poor accounting and transparency of comparable incumbent projects’ cost and timing data. Ultimately, data availability and quality limited the authors’ ability to make definitive conclusions in this analysis. As a result, the initial and prime recommendation to policymakers is to implement coordinated and standardized data collection and transparency—particularly with respect to incumbent transmission development—to inform further policy development. Regardless, while the number of completed competitive transmission projects is not large, the results (relative to comparative incumbent transmission projects) are instructive.
Speed to Market
Taking the entire planning and development process into account, the competitive greenfield transmission lines currently in service were developed faster than comparable incumbent projects in the California Independent System Operator (CAISO), MISO, the Southwest Power Pool (SPP), and the Independent System Operator New England (ISO-NE) planning regions of the country. To improve comparability, the timeline analysis primarily focuses on greenfield transmission line projects. Only in PJM have competitive lines taken longer to be planned and placed into service than comparable incumbent projects, with total timelines of about 20 percent longer. Incumbent projects across the country come in well past their original expected in-service dates. The exception to this observation is PJM, where incumbent developers of greenfield transmission lines only miss their expected in-service dates by a few weeks on average. Competitive and incumbent developers of greenfield transmission lines in CAISO and SPP place their projects into service late, with comparable delays. Delays may be region-specific (at least in CAISO), and evidence suggests the causes may impact competitive and incumbent projects similarly. The few greenfield competitive projects in MISO, ISO-NE, the New York Independent System Operator, and PJM came in ahead of schedule.
Figure 1: Median Time to In-Service: Competitive vs. Incumbent Transmission Projects by Region
Note: Comparisons reflect available completed projects with sufficiently comparable timing data
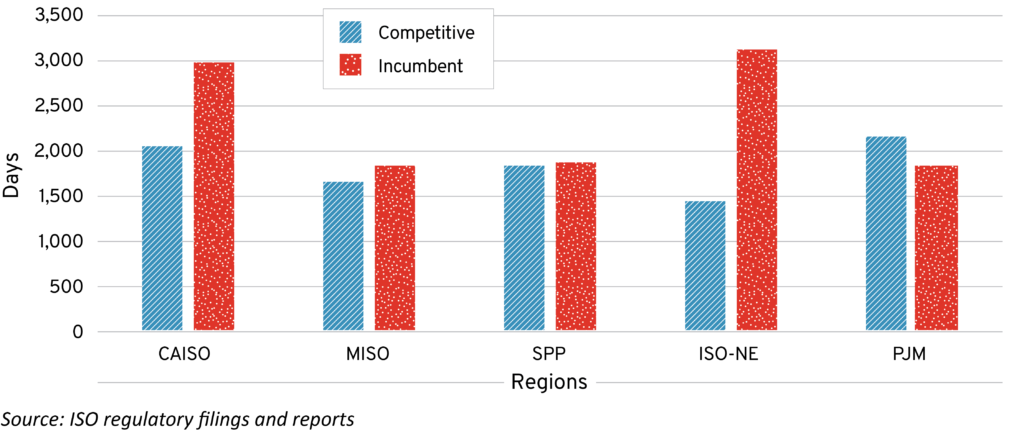
While project-specific outcomes vary by region and project type, the available completed-project data indicate that competitive transmission projects have generally reached service faster than comparable incumbent-developed projects across most planning regions. Figure 1 compares median time-to-in-service outcomes for completed competitive and incumbent transmission projects using the currently available dataset. Median values provide a better sense of typical project outcomes by reducing the influence of unusually timed (delayed or early) or otherwise atypical outlier projects.
Speed to market is not the only consideration when determining the efficacy of competitive transmission, however. The in-service observations are noteworthy, as the pace of planning and development was not a primary consideration in FERC’s initial decision-making. Given its focus on just and reasonable wholesale rates, much of the agency’s basis for introducing competition into transmission development was cost related.
Transmission Costs
Our analysis of project costs indicates that competitive solicitations drive cost savings across much of the country and that while final costs tend to be higher than bids or initial estimates for both competitive and incumbent projects, savings from competitive projects are in the 30 percent range as compared to incumbent projects. Consistent cost increases during development for both competitive and incumbent projects suggest industry-wide factors rather than developer-specific drivers. While there are regional differences, our analysis indicates that because incumbent and competitive projects both generally increase in cost from planning to being placed into service, initial savings based on bids from competitive solicitations—particularly those highlighted in previous analyses—are largely maintained (relative to incumbents) by the time projects go into service.
Given the relatively small number of competitive projects as well as data access and validity limitations, our analysis heavily relies on case studies; however, aggregate regional data is provided where available. These case studies provide insight into differences and similarities in regions’ competitive solicitation processes, as well as qualitative considerations of select projects. Many of these qualitative factors are considered as part of a region’s solicitation processes and ultimately impact the timing or cost of regional transmission projects. Our analysis shows that competitive projects often include in-service date commitments and financial penalties for being late, binding revenue requirement or capital cost caps, and capital structure commitments and return on equity caps for the life of the project. These factors impact consumer welfare and are considered by regional planners when selecting projects.
The details of this analysis will be published in five parts:
- Part 1—Introduction
Provides background on competitive transmission, a short review of relevant literature and related studies that help inform the need for this analysis, and a description of the methodology and data used. - Part 2—Timing
Focuses on the speed-to-market implications of transmission competition, comparing the time it takes to plan and build competitive transmission with similar incumbent projects and exploring experiences with delays across the two categories throughout most planning regions. - Part 3—Cost
Focuses on transmission costs, cost increases relative to initial estimates experienced by competitive and incumbent-developed projects, and the average final costs and savings offered by competitive projects relative to similar incumbent projects. - Part 4—Literature Review and International Experience
Includes a literature review and detailed summary of selected studies, identifying differences and consistencies with the present analysis and previous contributions to the subject. It also includes a review of other countries’ experiences with transmission competition or similar offerings, with a particular focus on outcomes in Brazil and the United Kingdom. - Part 5—Conclusion and Recommendations
Summarizes the analysis and clarifies the authors’ findings. It also includes general and prescriptive recommendations for policymakers based on the overall findings.