
What 1996 Can Teach Us About Today’s High Electricity Prices
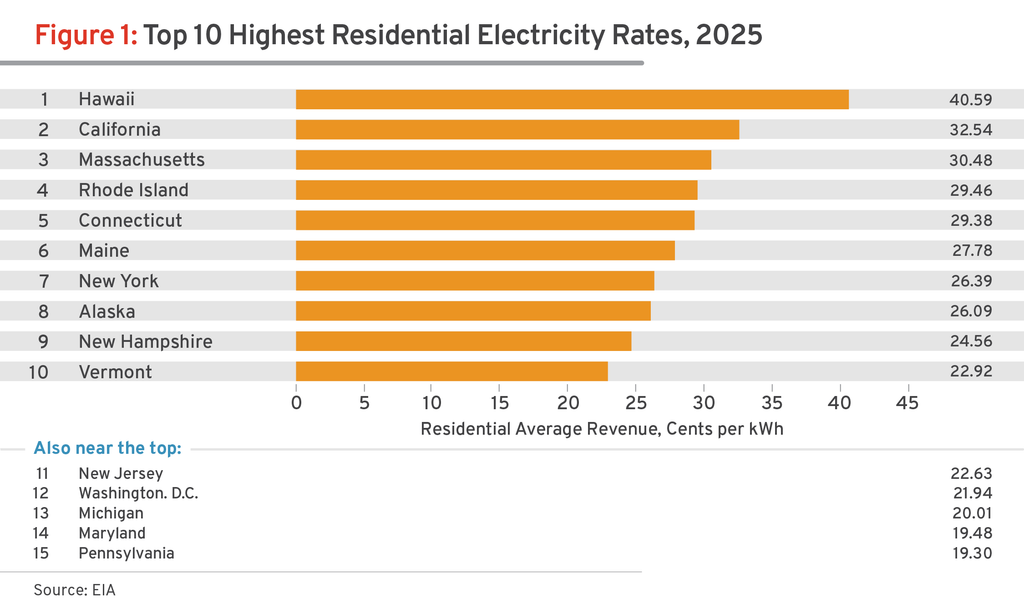
Electricity prices have changed a lot since 1996. The states with the highest prices have not. Nine of the ten states with the highest residential electricity prices in 2025 were also in the top ten in 1996. Figures 1 and 2 show the top ten lists for both years according to the U.S. Energy Information Administration (EIA), with the 1996 rates adjusted for inflation. Rankings show us where electricity prices are high, but they do not tell us why.
Electricity Prices Since 1996
In every year since 1996, eight or nine of the states in the 2025 top ten also appeared in that year’s top ten. Over the last thirty years, the electric industry saw the arrival of wholesale power markets, large wind and solar buildouts, the shale gas boom, coal and nuclear power plant retirements, and now rapid load growth. A consistent small group of states remained among the most expensive: six New England states, New York, California, Alaska, and Hawaii.
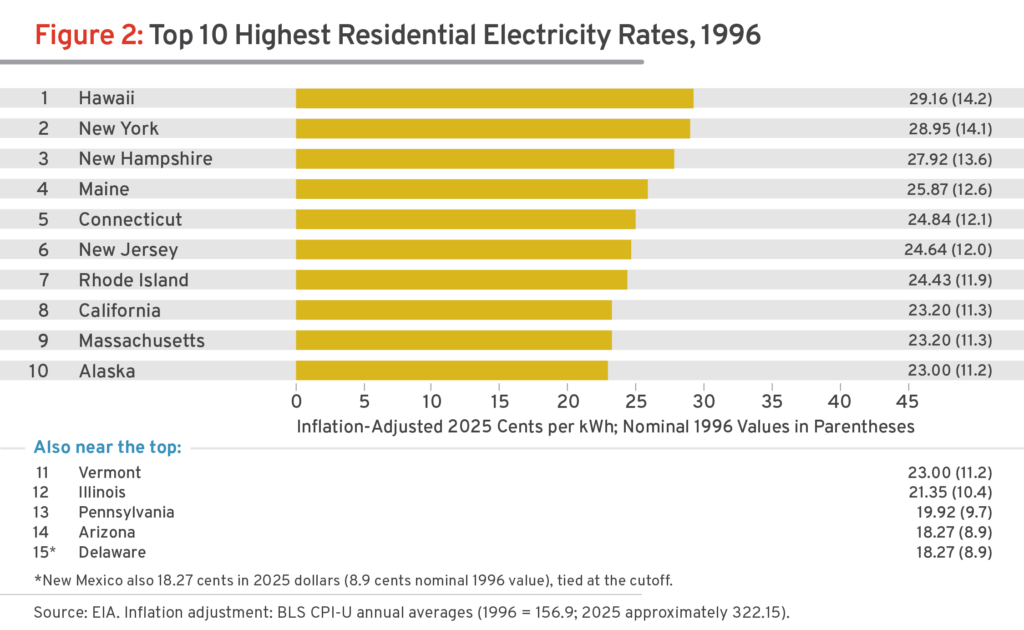
These high prices were the main reason why state policymakers experimented with industry reforms in the first place. Industrial customers worried that high prices put them at a competitive disadvantage, and residential customers wanted lower utility bills. Eight of the ten states on the 1996 list—all but Alaska and Hawaii—adopted restructuring reforms intended to introduce competition.
A Tale of Two Reports
Today’s high prices are offered as evidence against restructuring. Power for Tomorrow (PFT), an organization advocating traditional utility regulation, divided states into “regulated” and “deregulated” categories and argued that higher prices in its deregulated group show that restructuring raised costs. However, the 1996 data shows these same states had higher prices before the reforms took place.
In contrast, the Retail Energy Supply Association (RESA), a trade association representing competitive energy suppliers in retail choice states, used data from the same government source to report that average residential rates in retail choice states fell by 2.6 percent from 2008-2025, once adjusted for inflation. Residential rates rose 8.5 percent in regulated monopoly states over the same period with the same inflation adjustment.
RESA’s report usefully shows trends over time, while the PFT study offers little more than a snapshot. Both reports summarize data in a way that doesn’t itself provide much basis for drawing conclusions. There are other reasons, too, not to rely on the PFT numbers. The report says it defines “deregulated” to mean the state’s utilities participate in restructured, RTO/ISO-based competitive power markets, but their calculations are based on whether a state allows residential customers the opportunity to choose their own energy supplier. PFT’s calculation of the national average price does not match the EIA’s calculation of the national average, despite relying on the same data.
Policy Impacts Electricity Prices, But So Do Other Factors
A 2025 publication by Lawrence Berkeley National Lab took a more systematic look at average rates in the 48 contiguous states from 2019-2024. Inflation-adjusted prices fell in 31 states, rose in 17, and were roughly flat in the others, with substantial differences in the factors driving price changes across the states. States with the largest real price declines generally had growing customer demand, while the states with the largest increases had shrinking use. Natural gas prices, storms and wildfires, and state renewable power policies were prominent factors associated with higher prices. A 2026 update to their analysis reports similar results.
Power for Tomorrow explains away high prices in Alaska and Hawaii by pointing to geography and fuel logistics. True, but those are not the only states with distinctive circumstances, and PFT’s report fails to consistently acknowledge these factors. For instance, New England states have long relied on imported LNG and fuel oil to generate power during the coldest winter periods, pushing costs higher there. However, if they had more piped natural gas, prices would be lower, and they would not need to import as much LNG. Meanwhile, California utilities have been faced with substantial costs from wildfires.
Competitive Reforms Are Delivering Benefits
Proponents of power industry reforms in the 1990s expected competition to reduce power prices. Multiple studies over the years provide clear evidence that wholesale competition reduced power costs: generation units operated more efficiently and lower-cost power plants ran more frequently in regions with competitive markets.
It is good that restructuring reforms let many residents now choose their electricity supplier. However, the results of this retail competition are harder to judge. One comprehensive study found prices rose for a few years after reforms were implemented, but soon were no worse than regulated rates would have been. Studies focused on Texas find different results depending on the period studied and research methods employed.
We can get some insights by drilling into the data a bit. A residential electric bill has three main parts: generation, transmission and distribution lines, and state policy-driven costs. Only power generation is open to competition in restructured states, and generation costs are down. Transmission is recovered through FERC-approved formula rates, and distribution is set through traditional cost-of-service ratemaking by each state’s utility commission, exactly as it is in regulated states. Those regulated components are where costs have grown fastest: according to the Clean Air Task Force, distribution spending rose 160% and transmission spending nearly tripled between 2003 and 2023—in regulated and restructured states alike. (Competitive transmission is growing and benefits consumers, but it is far from ubiquitous.)
On top of higher transmission and distribution costs, legislatures in many states have chosen to fund energy efficiency programs, demand response, low-income assistance, and other public policy goals through surcharges on the utility bill. All of it is folded into the single “residential price” PFT reports. Blaming that total price on competition is like blaming a restaurant’s chef for a high bill that is mostly rent, taxes, and a mandatory service charge.
Rankings are useful, but they are not everything. Nine of today’s ten most expensive states were already among the ten most expensive in 1996, before residential retail-choice reforms took effect. That does not tell us what those reforms did to prices, and a simplistic look at today’s rankings cannot tell us either.