The Inefficiency of Renewable Energy Subsidies
This is the second part to a series of posts on this topic. Scroll to the end to find the most recent posts.
Introduction
As the second part of our series of analyses on the Build Back Better (BBB) proposal, we are examining the renewable energy subsidies of the bill which passed the House of Representatives last year. Initially BBB aimed to have a $150 billion program called the Clean Electricity Performance Program (CEPP), which would pay electricity providers based on their year-to-year growth of renewable energy, and this would be in concert with a bevy of other subsidies for renewable energy. While the CEPP has been removed, the other subsidies remain, which this analysis focuses on.
Renewable Energy
The primary policies supporting renewable energy are expansions and extensions of the investment tax credits (ITC) and production tax credits (PTC). For eligible entities under the BBB proposal, the ITC covers 30 percent of the cost of new electricity generation facilities, and the PTC provides a tax credit per kilowatt hour (kWh) of electricity generation for new facilities that is either 0.5 cents per kWh or 2.5 cents per kWh for facilities that would meet new labor standards, as outlined in the tax credit requirements. The tax credits are mutually exclusive; filers will have to choose one or the other. Conventionally, the ITC has been favored by more capital-intensive projects with low capacity factors (meaning most of the time they do not produce electricity) such as photovoltaic solar, and the PTC has been favored by projects with higher capacity factors (meaning more electricity generation throughout the year), such as wind power.
The Congressional Budget Office (CBO) estimates the ITCs, both the extension of existing ones and new ones implemented by BBB, would cost $89.3 billion through 2031. This could support approximately $208 billion of new private investment in clean electricity generation, for a total of $298 billion of new investment. The CBO estimates the PTCs for renewable energy would cost $60.8 billion through 2031. Together these two subsidy types make up $150.2 billion, well over a third of BBB’s climate-related subsidies.
For this analysis, we assume all entities claiming the PTC are eligible for the full credit of 2.5 cents per kWh, and that all claimants to the ITC cover 30 percent of their costs. For simplicity, we assume that new generation covered by the ITC is photovoltaic solar, which currently claims most of ITC expenditures. We compare the estimated electricity generation supported by the tax credits to the Energy Information Administration’s (EIA) projected renewable energy generation, minus renewable energy generation from the base year of 2021. This results in the tax credits supporting 874 billion kWh of electricity generation by 2030, which is 290 billion kWh above the EIA’s projected value of 584 billion kWh of renewable energy generation above 2021 levels by 2030.
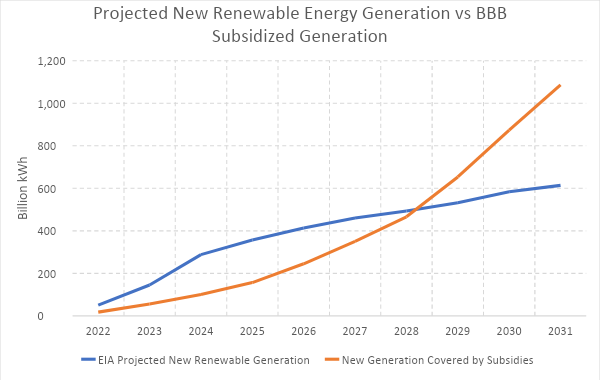
Sources: EIA AEO 2021 and RSI estimates based on CBO estimated budgetary effects for HR 5376.
Notice, though, that despite the renewable generation in 2030 being higher than the EIA projection, the cumulative renewable generation covered by the subsidies is nearly the same as the EIA’s projection, with the EIA estimating a total of 3.94 trillion kWh from 2022-2031, and the subsidies estimated to cover 4 trillion kWh over the same period, with the subsidized scenario ending up with 68 billion kWh above the reference case. Essentially emissions in 2030 with the subsidies would be 294 million metric tons lower—assuming that 294 billion kWh of electricity of coal electricity is replaced with renewables—which would make U.S. electricity emissions 22 percent lower in 2030, or overall energy-related emissions 6 percent lower.
Policy Efficiency
In isolating a single year of the policy window, the cost of the subsidies in year 2030—the year of President Joe Biden’s prominent emissions target—the United States would expend $33.7 billion on electricity-related subsidies to avoid 294 million metric tons carbon dioxide for a single-year abatement cost of $115 per ton—more than double the global environmental benefit. Isolating the analysis to the year 2030, though, could be described as unreasonably favorable in defense of the subsidies, because the total cumulative renewable generation over the period of the subsidies in the above analysis is only narrowly above the reference case, meaning the subsidies result in nearly the same environmental outcome than having no subsidies at all. This means the true abatement cost of the policy is much higher than $115 per ton. Such a finding would be consistent with the economic literature, which has found these subsidies can cost up to $2,100 per ton of greenhouse gas abated.
It also should be noted that there are non-greenhouse gas pollutant considerations that should be assessed; consider the health benefits of replacing a coal power plant with renewable energy generation. However, it should also be noted that natural gas has far lower criteria pollution than coal, meaning that it may be much more cost-effective to pursue these health benefits through fuel switching from coal to gas rather than from coal to renewable.
The total renewable energy generation coming in nearly the same as the baseline projections is a quirk of the difference between the CBO and EIA’s estimates, with the EIA estimating that the near-term presence of subsidies incentivizes new entry to market earlier and the CBO estimating more subsidy claimants later. The presence of subsidies should stimulate at least some new entry over the reference case, but the fact that the two estimates are so close together indicates that the CBO has either substantially underestimated the cost of the subsidies, or that the net environmental benefit from the subsidies is minimal.
The takeaway is the PTCs and ITCs, despite being the most expensive environmental provisions in BBB, are unlikely to produce significant additional environmental benefit, and are even less likely to do so at a cost that is below the benefit.
The fact that the subsidies are not expected to increase renewable electricity generation significantly above current projections indicates that growth is limited by other factors. For example, permitting and siting is often a bigger impediment to renewable energy deployment than cost. The majority of new market entry for electricity production is renewable energy, but deployment is far more contingent on regulatory reform rather than increased subsidy.
Conclusion
In a nutshell, the estimated costs of the program relative to the tax credit values do not indicate any significant increase in renewable energy uptake beyond what is expected to occur anyway. If this is correct, the environmental benefits of the tax credits are minimal. If this is incorrect, then the cost of the environmental programs will be much higher than expected, and thus less efficient. Given that we do not expect significantly higher renewable deployment above projections even with the presence of the subsidies, it is unlikely that BBB’s renewable electricity subsidies would reach the threshold of more benefit than cost and will only modestly contribute to President Biden’s 2030 emission targets. Estimates or assumptions that BBB’s electricity policies alone would result in total electricity decarbonization are unlikely to be accurate.
INTRODUCTION – Build Back Better: How Much Bang for the Buck?
PART 1 – The Costs and Benefits of Nuclear Power Subsidies
PART 2 – The Inefficiency of Renewable Energy Subsidies
PART 3 – EV Subsidies Likely to Have Minimal Impact
PART 4 – Alternative fuels subsidies are small in size but with interesting potential
CONCLUSION – BBB Series Summary and Conclusion