State and Local Permitting Restrictions on Wind Energy Development
Introduction
The wind sector is perhaps the most prominent example of state and local permitting imposing new restrictions on energy deployment, which could stymie its potential to satisfy future power sector demand. Electric power generation from wind from 2014 to 2023 has more than doubled, rising from 181.7 terawatt hours (TWh) in 2014 to 425.3 TWh in 2023. The Energy Information Administration (EIA) anticipates that wind power generation will increase sharply, largely on account of increased subsidies under the Inflation Reduction Act. This increased generation, however, is likely to be at least partially limited by increasing restrictions on the siting and deployment of wind turbines. This analysis utilizes the National Renewable Energy Laboratory (NREL) database of state and local ordinances to determine the degree to which policymakers should be concerned with the impact of these ordinances on national wind energy deployment.
Many County Level Ordinances are Very Restrictive to New Wind Development
The NREL database for wind siting catalogues 1,833 county- and city-level ordinances, and 58 state-level ordinances restricting the placement of wind turbines. There are 423 distinct counties listed, meaning 13 percent of U.S. counties have at least one ordinance restricting the development of wind energy. If state-level ordinances are included, 1,008 counties—roughly 30 percent—are under some form of ordinance restricting wind power siting. These ordinances take a variety of forms. Some are outright prohibitions on the siting of new wind turbines, others restrict the setback distance a wind turbine can be placed from a feature based on sound, distance, or a multiplier of the height of the wind turbine. In our analysis, we estimated setback distance requirements for sound and height based on available data. Wind turbines are typically placed 300 meters or more from a feature, such as property lines or bodies of water, but 32 percent of the setback ordinances in the NREL database exceed 300 meters.
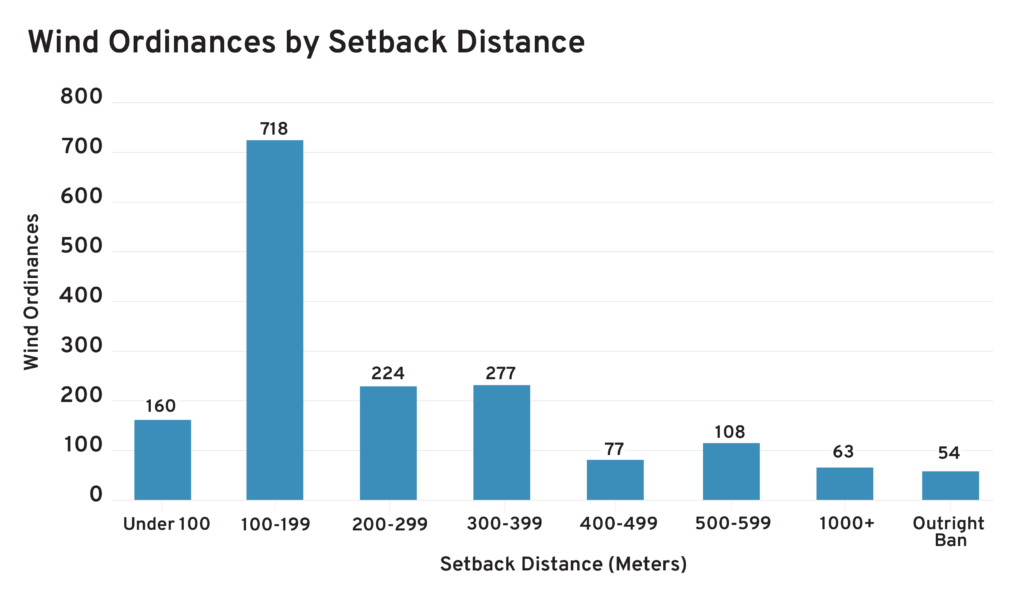
Additionally, we categorized the setback requirements based on their level of restrictiveness, with the least restrictive being under 200 meters, and the most restrictive being one kilometer or more.
| County-Level Restrictions on Wind from County Ordinances | County-Level Restrictions on Wind from Both County and State Ordinances | |||
| Number of Ordinances | Percentage of Ordinances | Number of Ordinances | Percentage of Ordinances | |
| Less Restrictive | 878 | 54% | 1537 | 57% |
| Nominally Restrictive | 451 | 28% | 459 | 17% |
| More Restrictive | 77 | 5% | 260 | 10% |
| Highly Restrictive | 171 | 10% | 386 | 14% |
| Prohibition | 54 | 3% | 54 | 2% |
Generally, our finding is that while most restrictions are only somewhat restrictive, a significant number of counties are under more restrictive policies (setback requirements greater than 500 meters), and this further increases when considering state-level ordinances.
A study in 2023 using the NREL database found that if every county adopted setback distances in the 90th percentile of ordinances, which would roughly fall into our “highly restrictive” range, the potential capacity of new wind power generation would fall from 14 TW to 2 TW—a reduction of 87 percent.
Trends in New Wind Ordinances
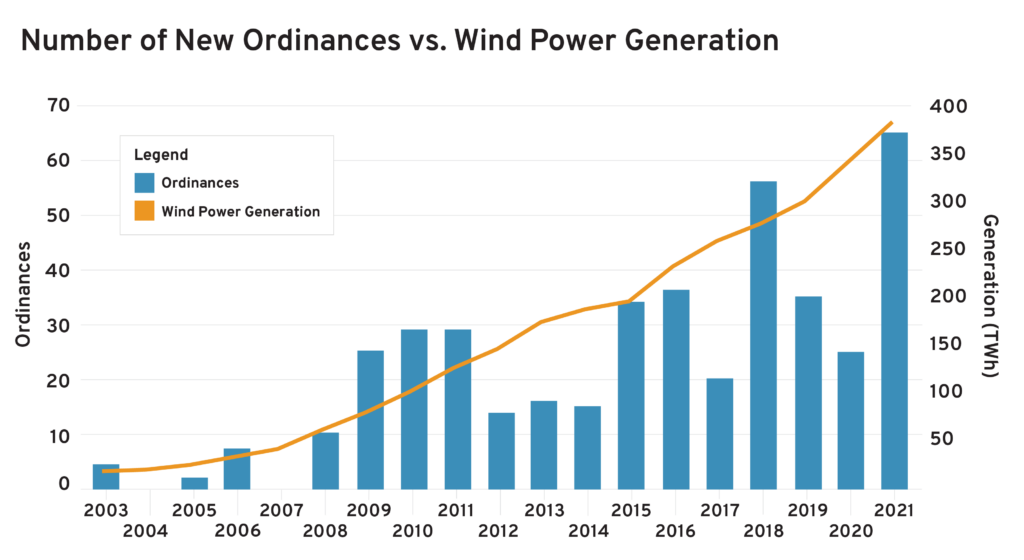
While we expect that the number of ordinances will increase over time, the rate of adoption of new ordinances is accelerating. The NREL database does not record the adoption date of each ordinance restricting wind power, but for the 423 county ordinances that do have years listed, we found that there were 16 times as many ordinances adopted in the last year for which we have complete data (2021) as compared to the first year (2003). Additionally, when we compare new ordinances to wind power generation in the United States, we see a matching trend, indicating that wind ordinances are likely a response to the increasing likelihood of living near permitted wind power. This would be consistent with findings that counties with or near wind power are also most likely to adopt restrictions on the development of wind power.
Importantly, not only are there more ordinances restricting wind power generation being adopted than ever before, but these ordinances are also becoming more stringent. The chart below details the average setback requirement of new ordinances by year.
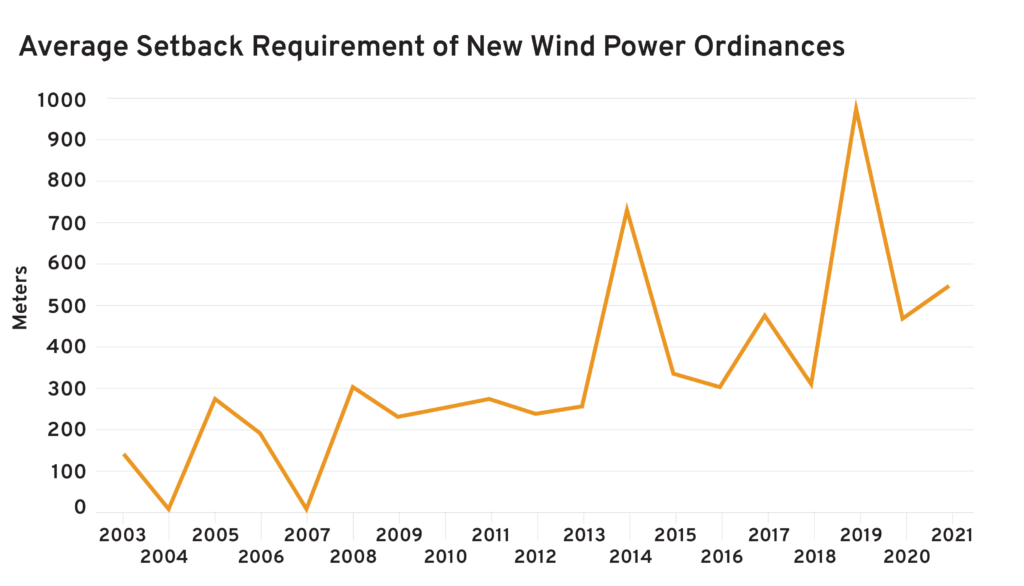
Simply, it is becoming more difficult to site new wind energy generation, and we expect this trend to continue. We also anticipate that future ordinances will be more numerous and restrictive than they have been historically.
Relationship Between Wind Generation Potential and Setback Requirements
Additionally, we compared the NREL’s database of technical renewable energy generation potential with the ordinance database and our estimated setback requirements. We found that for both less restrictive ordinances and highly restrictive ordinances, there was little correlation between the stringency of the ordinance and the potential wind energy generation. However, when excluding outliers in the data (counties with more than 100 TWh of potential wind generation, and setback restrictions greater than 1,000 meters), there was a statistically significant correlation between generation potential and the restrictiveness of setback ordinances (the p-value, or probability of the two variables not being correlated, being 0.9 percent). The chart below shows the average potential wind energy generation in counties ordered by the setback requirements of their ordinances.
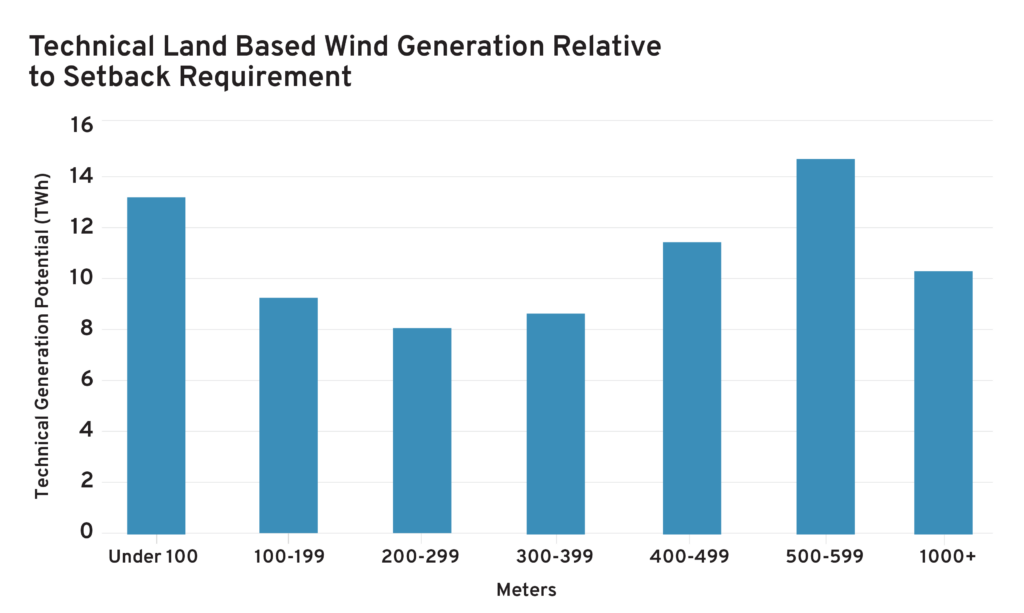
Our interpretation of this data is that at the extreme end of the most restrictive ordinances that are imposed on wind generation, it is likely that they are a result more of political or social desire rather than the likelihood of wind generation being present. This would make sense since ordinances that operate as de facto prohibitions are less likely to be motivated by how to limit exposure to infrastructure pragmatically. In the more moderate range of setback requirements, the significant correlation between wind generation potential and the setback requirement indicates that areas that are likely to develop large volumes of wind power are also more likely to encounter resistance from local populations that will prefer more stringent setback requirements.
Policy Insight
Although people generally have favorable attitudes toward renewable energy, with 75 percent of U.S. adults saying they favor expanding wind turbine farms, they may not be willing to site wind turbines near them. This “not in my backyard” attitude is one that is commonly referenced, but difficult to measure. A key policy question is whether communities’ concerns over the adverse effects of wind development can be mitigated without stifling development. For example, wind turbines make noise, and some recommendations for minimizing adverse impacts to communities from wind turbine noise recommend setbacks of greater than 700 meters, which are well within our “highly restrictive” category. If improved siting methods or technological advancements enable large mitigation of noise effects without preventing development, then alternative policy options may improve the net benefits of wind development to communities. Given current trends, we expect more numerous and more stringent ordinances restricting wind energy at both the state and county level going forward.
It is important to bear in mind, though, that if the entire country adopts restrictive ordinances and we are limited to 2 TW of wind capacity as the NREL study projected, that would still be a 13-fold increase from present levels of wind-generating capacity. But it should be noted that achieving net-zero emission targets in the United States may require more than 2 TW of capacity; the Princeton Net-Zero America pathways require between 6 and 26 times the current levels of U.S. energy coming from wind power. A more pressing problem may be if regions with optimal balances of proximity to transmission infrastructure and physical potential to generate power from wind are pursuing restrictive ordinances.
As an example, Texas is the state with the most wind power generation, accounting for more than a quarter of total U.S. wind-power generation. In the NREL database, there are 24 county-level ordinances restricting wind power in Texas, or about 1 percent of the recorded ordinances. However, 15 of those are outright prohibitions against new wind development, which accounts for 28 percent of all prohibitive ordinances. This indicates that regions that have or are likely to have wind power are also more likely to adopt restrictive ordinances, which concurs with a 2023 NREL analysis of wind ordinances, and is consistent with our own comparison of generation potential and ordinance restrictiveness.
Conclusion
State and local ordinances restricting wind energy development have the potential to be highly restrictive to future wind generation growth. Additionally, these ordinances are most likely to occur in regions that are also likely to develop wind energy, and counties with more generation potential are also more likely to adopt more restrictive ordinances. Wind generation, as a resource, is versatile enough that even comparatively low levels of development relative to total technical generating capacity mean that wind is likely to continue to be a significant electricity-generating resource for the United States. Nevertheless, siting restrictions may suppress wind development multiple times below its economic optimum.
It is currently unclear how restrictive state and local ordinances for wind power will be for the future of wind energy in the United States, but it is apparent that these ordinances are likely to play a far more significant role in constraining development than the effectiveness of policies designed to stimulate deployment.

Series: State Energy Infrastructure Permitting and Siting
Meeting electricity demands over the next few decades will require substantial infrastructure expansion throughout the energy sector. This new series surveys the challenges state and local permitting requirements pose to new energy infrastructure.