

The Perception Paradox: How Misaligned Public Beliefs About Crime Undermine the Full Continuum of Public Safety
Author

Table of Contents
- Executive Summary
- Introduction
- Why Public Perception of Crime Matters
- The Widening Gap: Belief Versus Data
- Crime Is Real
- Drivers of the Divergence
- How Public Perception of Crime Shapes Enforcement
- How Misalignment Distorts Public Safety Priorities
- Treating Perception of Crime as a Core Public Safety Domain
- From Evidence to Practice
- Key Recommendations
- Conclusion
- Appendix A: Documented Enforcement Cases
- Appendix B: Coding Key
Media Contact
For general and media inquiries and to book our experts, please contact: pr@rstreet.org
The current moment offers a rare opportunity—crime rates are falling, crime data is steadily improving, and public fear is finally beginning to ease. Together, these conditions make it possible to institutionalize the strategies that produced the decline and to bring public belief into line with the evidence before the next cycle of alarm reopens the gap. That work is within reach.
Executive Summary
National crime data has moved in an encouraging direction for the past several years. Data from the Federal Bureau of Investigation (FBI) shows that violent crime fell an estimated 4.5 percent in 2024, bringing the national violent crime rate to its lowest level since 1969, while murder rates declined 14.9 percent. Final 2025 data shows the improvement accelerating, with the largest year-to-year declines in violent crime and murder rates since the FBI estimations began in 1936 and a murder rate tied for the lowest ever recorded.
While the trend is genuine and worth crediting, many Americans do not yet feel the difference. In 2023, a record 63 percent of U.S. adults called crime an extremely or very serious national problem, and those who reported being afraid to walk alone at night near their home reached a three-decade high. Perceptions have since moderated: By 2025, the serious-problem figure had fallen to 49 percent and the fear measure to 31 percent. Even so, the gap between what the data shows and what the public believes remains substantial. More important than the direction of the gap is its persistence. Public perception of crime has repeatedly deviated from the measured reality of crime statistics. This discrepancy is not a polling artifact. Because perception drives funding, enforcement priorities, deployment, and trust, a persistent misalignment between belief and data skews all four, which is itself a public safety problem.
This study argues that crime perception is a core public safety variable. Its central claim is that public perception of crime, however loosely tied to the data, functions as an operating input to the public safety system—one that shapes appropriations, drives the deployment of officers and investigators, and conditions the public trust on which the whole effort depends. When that input is poorly calibrated to actual harm, the costs carry through every stage of the continuum, from deployment to the back end of the system. An agency that ignores what its community fears would forfeit legitimacy, so the practical question is one of calibration—whether the resources that public perception sets in motion land where harm is concentrated, and what it costs public safety when they do not.
To show how this works in practice, this study inverts the question that dominates research on policing and public opinion. Most of that research asks how police tactics shape what communities believe; this study asks the reverse—how does community perception shape what police do? Drawing on a national set of 51 documented enforcement actions from 2021 through 2026, each publicly tied to a community concern, complaint, or publicly identified community crime problem, it finds a consistent pattern in which visible, complaint-generating problems reliably draw visible enforcement responses, sometimes well aligned with evidence and sometimes not.
Introduction
Reported crime in the United States has been declining for most of the past three decades, but public belief has rarely reflected that decline. After a significant pandemic-era rise in violence that peaked in 2020 and 2021, crime rates have fallen for multiple consecutive years, with 2025 figures being among the lowest recorded in decades. There is reason to view that rebound as more than good luck. A recent macro-criminological analysis modeled five decades of national crime against 15 gradual structural conditions, from residential turnover and homeownership to civic engagement and guardianship, and found that those conditions kept improving through 2020 and 2021 even as homicide jumped by roughly one-third in a single year; once the disruptions of the pandemic era receded, homicide settled back onto the trajectory those 15 structural conditions predicted all along. The spike, in other words, behaved like a temporary shock to a stable system rather than a reversal of it. Public belief, however, absorbed the shock immediately and has been far slower to recover. For much of the same period, most U.S. adults polled believed that crime was rising and reported feeling less safe.
The distance between measured and perceived realities is not new, but its recent scale is striking, and the mechanisms sustaining it have grown more powerful. A fragmented media environment, an always-on stream of viral incident footage, and the deepening partisanship of crime as a political issue have combined to keep public fear only loosely tethered to underlying data. Genuine confusion within the data has compounded the gap: For several years, the nation’s two principal crime measures—the FBI’s Uniform Crime Reporting (UCR) program and the Bureau of Justice Statistics’ (BJS) National Crime Victimization Survey (NCVS)—pointed in opposite directions, making it reasonable for people to wonder which was accurate.
Whatever its sources, the gap raises a question the literature has largely left unasked. Research on crime and public opinion has overwhelmingly focused on how policing tactics shape what communities believe and feel about crime. This study deliberately reverses that inquiry. It treats community perception as an input rather than an output and asks how that perception shapes the behavior of law enforcement and the broader public safety enterprise: how fear and complaint drive deployment, how political pressure translates perceived danger into command-level priorities, and how the allocation of scarce public resources follows belief as much as data.
This study arrives at a significant moment. Public alarm about crime has eased from its 2023 peak, and crime data itself has become timelier and more accessible than at any other point in the modern era. The FBI now publishes national data monthly rather than annually, and in May 2026 issued its first preliminary annual estimates. In addition, independent projects such as the Real-Time Crime Index and the Live Crime Tracker maintained by NORC at the University of Chicago aggregate hundreds of local open-data feeds into national trend dashboards. Together, those two shifts create a rare opening to recalibrate—to lock in the gains, credit the strategies that produced them, and align future investment with evidence rather than with the anxieties of the moment. This window of opportunity is unlikely to remain open indefinitely. Crime discourse remains deeply politicized, and the mechanisms that sustained the perception gap over the past two decades—media salience, partisan framing, and the amplification of isolated incidents—remain fully intact and capable of reopening it.
The analysis that follows is organized around a single proposition: narrowing the distance between public perception and measured reality is itself a public safety strategy, one with direct implications for the efficient allocation of taxpayer resources, the safety of communities, and the effectiveness of the officers who serve them. To support that premise, this study first documents the gap between belief and measured crime, along with the mechanisms that sustain it. It then presents original evidence on how that gap becomes consequential: 51 documented enforcement actions in which community concern translated directly into resource deployment. It continues by tracing what a poorly calibrated perception costs at each stage of the continuum—deployment, investigation, the workforce, and even reentry programs. The analysis extends beyond incarceration because public perception does not stop at the patrol car; the same public mood that floods a neighborhood with patrol officers also decides whether a reentry program survives its next budget cycle.
Why Public Perception of Crime Matters
Crime perception matters because the people who make public safety policy—elected officials and the agencies accountable to them—face strong incentives to respond to what constituents believe as well as to what the data indicates. Constituents’ influence runs through three channels.
The first channel is legislative. The salience of crime in public debate shapes appropriations for policing, courts, corrections, and prevention programs, as well as the substance of criminal law itself. When fear is high, money and statutory attention flow toward visible, immediate measures, and lawmakers compete to demonstrate strength. When fear recedes, support for sustained investment can recede with it, regardless of what the underlying trends require. Because budgets are written annually and fear moves on its own schedule, the result is a public safety enterprise funded to perception as much as to need, expanding in moments of alarm and retrenching in moments of calm.
The second channel is operational. Law enforcement agencies do not deploy solely against crime rates; they deploy against the concerns residents bring to them through calls for service, community meetings, council testimony, and complaints about disorder. Much of that signal reflects real crime and real harm. But the number of complaints an issue generates is an imperfect proxy for the degree of harm it causes. Visible, irritating problems generate sustained complaint streams, while the most serious violence is concentrated among a small number of people and places and tends to generate few calls. Responding to community concerns is an important part of policing; an agency that ignored reported issues would forfeit community trust. But when responsiveness is untethered from evidence of where harm actually concentrates, it can pull scarce investigative and patrol capacity toward whatever is most complained about rather than whatever is most dangerous.
The third channel is cooperation. Investigations, prosecutions, and crime prevention all depend on residents’ willingness to come forward, and that willingness is itself a product of perception. Public confidence in law enforcement depends heavily on whether people believe the system is working, and that opinion is formed as much by narrative as by outcomes. Even amid record declines, most reported crimes are never solved, and more than half of violent victimizations are never reported to the police. Reporting and cooperation are themselves products of perception. When people believe crime is rampant and accountability is rare, they are less likely to report offenses, cooperate as witnesses, or support the agencies working on their behalf, thus eroding the very capacity needed to sustain the gains.
These forms of influence operate across the full continuum of public safety. Public perception can grant or withdraw the political will prevention programs depend on; enforcement priorities follow perceived threat; prosecutorial and court resources are allocated against public expectations; and reentry efforts—often vulnerable to fear-driven politics—rise or fall with the public mood. The perception gap, in other words, reaches every stage of the system. The distortion accumulates through thousands of ordinary budgeting and deployment decisions, each small enough to pass unnoticed.
The Widening Gap: Belief Versus Data
Gallup has tracked public perception of crime since the 1960s, and the long record reveals a striking, durable pattern. For most years since 2000, a majority of U.S. adults (69 percent, on average) believed that crime was rising nationally even when it was falling. The divergence widened sharply in the early 2020s as perceptions of rising crime climbed to levels last seen in the 1990s. The share of those surveyed calling national crime “extremely” or “very serious” hit a record 63 percent in 2023, and the proportion of respondents afraid to walk alone at night near their homes reached 40 percent—its highest point since 1993.
Those perception figures have since improved. In Gallup’s October 2025 survey, the share describing national crime as extremely or very serious fell to 49 percent, the share saying crime had increased over the prior year also fell to 49 percent, and the fear-of-walking measurement dropped to 31 percent. Although this improvement corresponds to a real decline in crime, perception has adjusted at a slower rate than the crime data. For example, the share of those surveyed worried about having their home burglarized declined only modestly between 2000 and 2025, from 48 percent to 34 percent, over a period in which the reported residential burglary rate fell by roughly three-quarters. In other words, almost half the country still believed crime was worsening in a year when every major measure showed it declining.
This gap becomes even more pronounced when national figures are set against local ones. In the same 2025 survey, only 12 percent described crime in their own local area as extremely or very serious; this is a divergence Gallup and other researchers describe as a persistent “local positivity bias.”
Part of the explanation for this divergence was, for several years, genuine confusion regarding the official data. Violent crime did rise in 2020, led by a nearly 30 percent increase in homicide. As that spike receded, the nation’s two principal crime measures, the FBI’s Uniform Crime Reporting (UCR) program (which counts offenses reported to police) and the Bureau of Justice Statistics’ (BJS) NCVS (which surveys the public directly), deviated sharply. Beginning in 2022, the UCR showed violent crime falling while the NCVS showed victimization rising—a gap that may partly reflect declining reporting to police, since the survey captures crimes that never enter police data. With experts reading the trend differently, public skepticism of the encouraging headline figures was reasonable. That ambiguity has since resolved toward decline, but it illustrates how the perception gap can stem not only from fear but also from the genuine difficulty of interpreting crime trends in real time.
The 2025 data extends the pattern. Violent crime fell an estimated 9.3 percent, property crime fell 12.4 percent, and the murder rate dropped to 4.1 offenses per 100,000 inhabitants—tying 1955 and 1956 for the lowest rate since national estimates began. Burglary, larceny-theft, and motor vehicle theft rates each reached 20-year lows. Independent analysts predicted these results months before the official release. The Real-Time Crime Index, which aggregates reports from hundreds of agencies, recorded roughly 20 percent fewer murders in the first 10 months of 2025 than in the same period of 2024, closely anticipating the FBI’s final full-year estimate of an 18.1 percent decline. That the independent and official measures, built from different agency samples over different windows, landed so close together is evidence of how broad and well documented the improvement is.
Preliminary figures for the first half of 2026 show the decline continuing. The FBI’s early data shows reported violent crime down another 10.6 percent nationally from the same period in 2025, and a Major Cities Chiefs Association survey of 66 large law enforcement agencies recorded homicides down 17.2 percent.
Crime Is Real
Even amid these measured improvements, the FBI estimated that more than 1.1 million violent crimes, including more than 14,000 murders, occurred in the United States in 2025. These crimes leave behind a vast number of victims, and aggregate crime-rate improvements offer little comfort to those who are robbed, assaulted, or bereaved. Moreover, these improvements are unevenly distributed. Although murder fell across communities of every size, some cities remain well above their pre-pandemic violence levels, and a small number of neighborhoods continue to absorb a disproportionate share of serious harm. For residents of those areas, reassurance about improvements in national crime rates can ring hollow, and their elevated fear reflects a real and present danger rather than a misreading of the statistics. Even victimization data, which generally shows long-term decline, registers pockets of deterioration. For instance, the rate of property victimization in urban areas rose between 2022 and 2023, even as the national picture held steady. Concern over city crime rates is broadly shared. In a September 2025 national survey, roughly seven in 10 U.S. adults said the level of crime and violence in cities was unacceptably high, and nearly half believed that crime nationally had increased over the prior year.
Some categories of crime are also genuinely growing, and public concern has followed them. Even as perceptions about crime improved overall in 2025, many respondents remained concerned about financial crimes such as identity theft and scams, and parents continued to fear for their children’s safety—concerns that persist precisely because they reflect real and rising exposure. In addition, victims experience property and quality-of-life offenses (e.g., retail theft, vehicle break-ins, package theft) directly and frequently, shaping perceptions of safety in ways that homicide statistics do not.
Fear is unevenly distributed as well. Women, residents of lower-income households, and people living in cities consistently report higher levels of concern about walking alone at night, but those differences correspond to real disparities in exposure to violence and disorder. The pattern is one of the oldest findings in the fear-of-crime literature, which attributes it in part to differences in perceived vulnerability and in the seriousness of the offenses people fear. It also extends to the young. Among those ages 18 to 29, 38 percent said crime and disorder in the country were getting worse and only 10 percent said they were improving, with young women far more likely than young men (39 percent versus 22 percent) to report feeling unsafe walking in their communities at night—and with financial circumstances outweighing race, gender, and politics as a predictor of feeling safe. Acknowledging that these fears are rooted in real exposure is essential to the argument that follows. The resources, attention, and political will directed at public safety must be calibrated to where harm is genuinely concentrated and to the people who bear most of it.
Drivers of the Divergence
Given that crime is falling and most people judge their own neighborhoods to be relatively safe, it is important to consider why pessimistic beliefs about national crime have persisted for so long. The answer lies less in the crime rate itself than in the channels through which the public learns about crime beyond their own experience. Several mechanisms work together to sustain public fear independent of the data.
The Media Salience Engine
The most durable finding in this literature is that coverage, not incidence, drives concern. A longitudinal analysis of network television crime reporting found that the volume of crime coverage predicted public fear far more strongly than actual crime rates did, with media salience explaining a large share of the variance in public concern even as crime trends diverged from it. This dynamic is an old one: Cultivation research dating to the 1970s found that heavy television viewers systematically overestimate their own likelihood of victimization. Later survey research confirmed this relationship in the era of modern local news: Frequent viewing of local television news predicts fear of crime independent of local crime rates and personal victimization. Analyses of national survey data reach the same conclusion. National outlets, by design, surface the rare, violent, and geographically scattered incidents that make a nation of more than 340 million seem perpetually dangerous, even when such events are statistically uncommon. A single shocking case can be covered everywhere at once, creating the impression of national risk, even for an isolated tragedy. This phenomenon continues to produce a powerful pipeline of fear because crime remains among the most consumed local news stories. A 2024 survey found that Americans are more likely to get news about crime than about almost any other local topic and that those most attentive to local crime coverage express the greatest concern about it.
The Social Media Accelerant
Where broadcast media once set the fear agenda on a daily cycle, networked and algorithmic media now do so continuously. Viral footage of a single brazen theft or assault can reach millions within hours, detached from any sense of how rare such events actually are, and content-recommendation systems reward precisely the emotionally arousing content that crime imagery supplies. Large-scale analyses of online platforms confirm the incentive structure, finding that negative and divisive material reliably draws more clicks and shares than neutral material. What’s more, for a growing share of the public, these platforms have become the primary point of contact with news material, rather than a supplement to it. Roughly three-quarters of adults under 30 get news from social media at least sometimes, and about one-third turn to social media first when news breaks. This means an algorithmically sorted feed is often a young adult’s first account of any high-profile crime. The result is an information environment in which the supply of alarming crime content is effectively unlimited and only loosely tethered to whether crime is rising or falling. A video of one smash-and-grab, replayed across platforms, can shape the public’s sense of an entire city and, through it, the political pressure that city’s leaders feel.
The Partisan Lens
Crime perception has also become measurably partisan. Analyses of long-run Gallup data show that those surveyed report lower fear and lower perceived crime when their own party controls the executive branch and higher fear when it does not—a pattern especially pronounced in recent years. The 2025 data illustrates the swing: Following the change in administration, the share of Republicans saying national crime had increased fell 36 percentage points in a single year, a shift far larger than any change in the underlying crime rate. In the same survey, 69 percent of Republicans rated national crime as extremely or very serious, compared with 37 percent of Democrats, a gap that reflects political alignment as much as any underlying difference in exposure. When perceptions of crime track partisan trends more closely than the crime rate, they cease to be a reliable guide of where danger actually lies.
Personal Experience and Economic Sentiment
Politics is not the whole story, however, and recent research suggests it may matter less than the partisan pattern implies. A 2026 analysis of decades of Gallup data found that household victimization (i.e., whether anyone in the respondent’s home had been a victim of a crime) was among the strongest predictors of both fear and the belief that crime is rising, and that property crime and direct personal experience were more closely tied to concern than actual violent crime rates were. Economic sentiment mattered as well. Respondents who said it was a good time to find a job, or who expected to maintain their holiday spending, were less likely to say crime was rising and less likely to report fear of walking alone at night. Strikingly, once economic conditions and other variables were accounted for, political party affiliation itself was not a significant predictor, suggesting that some of what registers as partisan perception may in fact be economic anxiety expressed in partisan terms. For law enforcement agencies, the practical implication is direct: Because concern is anchored in lived experience with property and quality-of-life offenses, visible progress against these offenses—not just against headline violence—is what moves how safe people feel.
Signal Crimes and Visible Disorder
Not all offenses carry equal weight in the public mind. Certain visible crimes and signs of disorder function as outsized signals of danger, shaping perceptions of safety far beyond their share of total crime. A boarded-up storefront, an open-air drug market, or a widely shared video of a chaotic retail theft can define a community’s sense of security regardless of what the aggregate numbers say. This is the core perceptual claim behind the “broken windows” account of disorder: Visible signs of lawlessness communicate vulnerability and invite further offenses. Evidence for the theory’s full causal chain remains contested, but its perceptual half has held up in field research. Studies that measure disorder, crime, and residents’ attitudes independently find that visible disorder erodes feelings of safety and neighborhood attachment even after accounting for the underlying rate of serious crime. At the same time, perceptions of disorder are themselves imperfect measures of conditions on the ground. For that reason, this study treats visible disorder—what residents see and report—as a driver of perception rather than as a measure of it; complaints about disorder are the main channel through which a neighborhood’s sense of safety reaches its police department. Systematic observation research finds that an area’s social composition, along with objectively visible conditions, shapes residents’ judgments of neighborhood disorder. Although debates over the enforcement tactics associated with the theory remain unsettled and are beyond the scope of this study, the underlying observation stands on its own. Disorder and quality-of-life concerns dominate the complaints residents bring to the agencies, which helps explain why those concerns so reliably drive public safety agendas.
The Local Positivity Bias
Finally, Americans systematically judge the nation more harshly than their local surroundings. Direct experience checks beliefs about the local area but not beliefs about the country, so the national picture of crime is constructed largely from mediated impressions, which skew negatively. This split is one of the oldest findings in the risk perception literature. Research four decades ago demonstrated that media exposure shapes judgments about danger to society while leaving judgments about personal risk largely untouched—a pattern termed the “impersonal impact hypothesis.” Recent survey research continues to find that media consumption, rather than direct experience, predicts beliefs about national crime. Gallup’s analysis of a quarter century of polling quantifies the bias. Assessments of national crime have averaged 43 percentage points more negative than assessments of local crime—a gap present in every survey since the series began in 2000. The persistent 40-plus-point gap between national and local crime assessments is, in effect, the measurable footprint of perception detaching from experience. Together, these mechanisms explain how public fear can rise and fall on a schedule of its own, only loosely tied to the measured crime rate. That detachment matters because perceived danger does not remain confined to public opinion; it becomes pressure on law enforcement agency response.
How Public Perception of Crime Shapes Enforcement
Most research on policing and public opinion asks how policing shapes perception. This study assesses the inverse: how public perception shapes policing. Two related questions structure the analysis:
- How often does community concern, rather than crime data, prompt enforcement action?
- When concern is the trigger, are the responses agencies choose calibrated to actual harm and aligned with the evidence on what works?
The answers to these questions matter because law enforcement agencies are built to respond—to calls for service, to community meetings, to the complaints residents and elected officials bring to them. But when the public perception of crime behind those calls and complaints is detached from the distribution of actual harm, responsiveness can inadvertently become misallocation.
Methodology and Limitations
To examine how agencies respond in practice, this study compiled a national set of 51 documented enforcement actions from 2021 through 2026, each publicly tied to a community concern, complaint, or publicly identified community crime problem. The coding does not assume these concerns were unfounded, and many reflected real crimes. The unit of analysis is the documented trigger, meaning the concern or complaint that the agency itself cited as prompting the action. Whether that concern was well calibrated to actual harm is not assumed or weighted either way—the evidence-alignment coding assesses that factor. Cases were drawn from agency press releases and from local news reports quoting agency officials and were selected to span a wide range of U.S. policing settings and concerns: municipal police departments and county sheriffs; large cities, suburbs, and rural counties; and concerns ranging from open-air drug markets and gun violence to street racing, dirt bikes, retail theft, agricultural theft, and quality-of-life disorder. Each case was coded along five dimensions—the jurisdiction and agency type, the community concern that prompted the action, the primary enforcement approach the agency took, that approach’s alignment with evidence-based practice, and the measure of success, if any, that the cited source reported.
Three limitations should be stated. First, the set is illustrative and is not a random sample. It cannot support claims about national frequencies, and it is not offered as one. Cases that agencies publicize may skew toward visible, complaint-driven operations precisely because those are the operations agencies have an incentive to announce—which is itself part of the dynamic under study. Second, coding an operation’s “alignment with evidence” is a matter of informed judgment, not a precise measurement. Relatedly, many operations combined tactics, such as directed patrols paired with community engagement. Each case was coded by the primary approach as the cited source described it, which necessarily flattens some mixed strategies into a single category. Third, the reported-success coding captures the claim made in each case’s cited source, not the operation’s broader public record; an agency may have measured or publicized results elsewhere without that evidence appearing in the announcement coded here. With those caveats, the set offers something the aggregate statistics cannot: a concrete, national picture of the recurring pattern in which a visible, complaint-generating problem draws a visible enforcement response.
Coding Definitions
The enforcement approaches fall into six mutually exclusive categories, and each case was coded by its dominant tactic:
- Targeted investigation/warrant denotes an investigation of specific suspects or locations culminating in search or arrest warrants.
- Intelligence/technology-led denotes a response driven by tools such as ballistics matching, real-time crime centers, license plate readers, or drones.
- Hot-spot/focused deterrence denotes resources concentrated at identified high-harm locations or directed against identified drivers of violence.
- Problem-oriented/data-driven denotes conditions analyzed through data and addressed with a mix of enforcement and non-enforcement tools.
- Saturation/directed patrol denotes a broad, stepped-up enforcement presence, sweep, or directed patrol across an area.
- Community-oriented/reassurance denotes visibility and engagement aimed primarily at restoring a sense of safety or trust.
An “evidence-aligned response,” as the term is used in this study, is a response from the first four categories, each of which carries stronger empirical support in the evaluation literature. Saturation and sweep tactics are coded as broad/reactive, reflecting weaker evidence of lasting effect, and community-oriented responses are coded separately as community/reassurance. The alignment code describes the strategy class, not the wisdom of a particular deployment; a saturation detail may be a defensible choice in a given moment even though the approach as a class has weaker evidentiary support.
Reported success metrics were coded to the strongest claim in the cited source out of the following:
- Measured outcomes require a specific, falsifiable change in crime, harm, victimization, or response times, with a stated magnitude or period.
- Outputs only captures enforcement activity such as arrests, citations, seizures, and impounds.
- A reassurance or perception claim is an assertion that an operation restored a feeling of safety, visibility, or trust, without an activity total or outcome claim attached.
- None reported means the source announced the action without claiming results.
The full coding key, including concern-category definitions and coding conventions, appears in Appendix B.
A National Pattern in Documented Cases
Coding each case by its primary enforcement approach reveals the texture of that response (Figure 1). The single most common reaction to community concern was saturation or directed patrol (flooding an area with visible officers), which accounted for 16 of the 51 cases. Focused and investigative approaches together made up the larger portion of the approaches with the following divide: targeted investigations and warrants (9 cases), hot-spot or focused-deterrence operations (9), problem-oriented or data-driven responses (9), and intelligence- or technology-led operations such as ballistics-network and license-plate-reader work (5). A smaller set (3) were explicitly community-oriented or reassurance-focused. The type of concern also shapes the type of response—a pattern examined below when the same cases are re-sorted by concern.
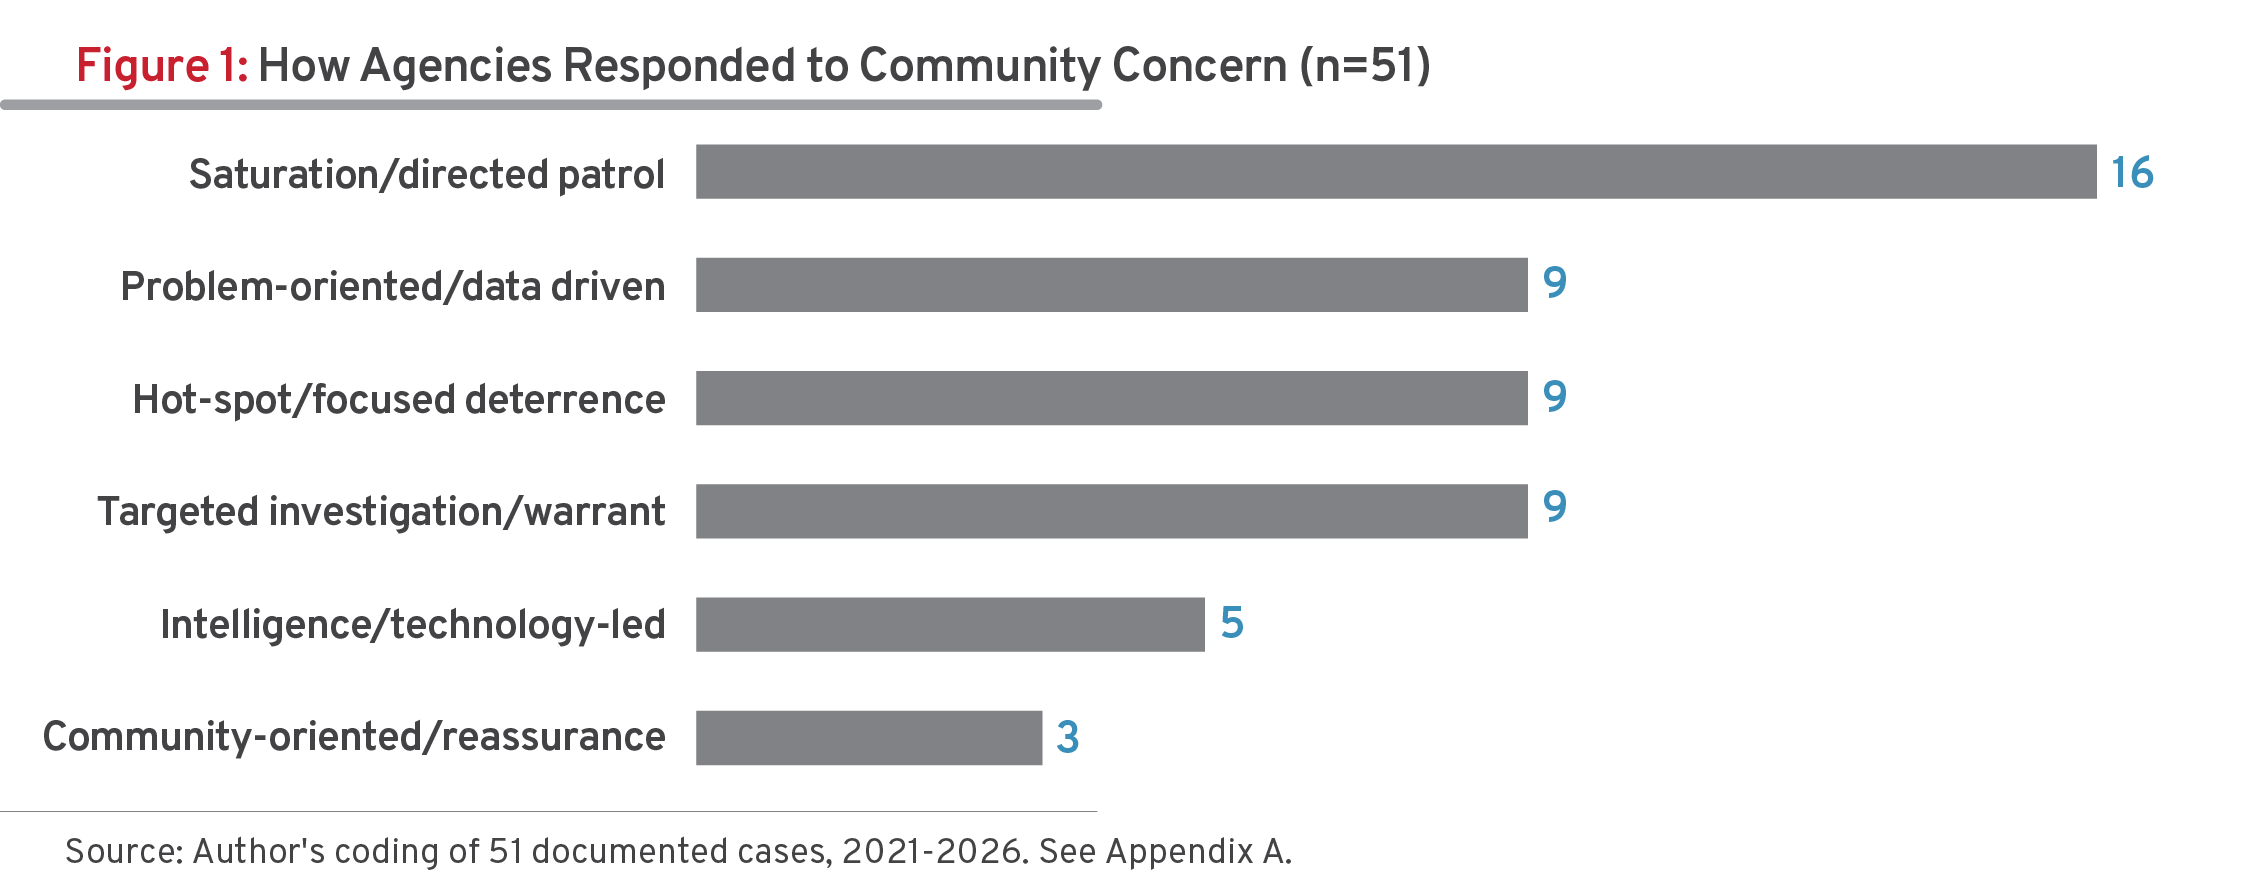
When each response was assessed for its alignment with evidence-based practice, the picture is genuinely mixed. Thirty-two of the 51 responses were coded as focused or evidence-aligned—the kind of targeted strategy that criminological research associates with real crime reduction. But 16 were broad or reactive, and three were primarily about reassurance. In other words, a meaningful share of the enforcement effort generated by community concern was directed less at where harm was concentrated than at where it was felt and seen. Saturation patrol can deter, and reassurance has value. This pattern shows that perception and harm are two different inputs and that agencies are routinely expected to respond to perception. The encouraging finding is that responsiveness and evidence can coexist. Across the four focused categories combined, most of the responses in the sample met community concern with a targeted, defensible strategy, although no single category was as common as saturation patrol. The cautionary finding is how often the broadest, most visible tool was still the first resort. Part of the explanation is likely related to capacity rather than preference. Most of the nation’s roughly 18,000 law enforcement agencies employ fewer than 25 sworn officers, with no crime analysts, research partnerships, or evaluation budgets. Any department can field extra patrol with overtime, reassignment, or mutual aid, and several of the saturation operations in this set were multiagency efforts assembled for exactly that purpose. Focused strategies demand more, including the analytic capacity to identify where harm concentrates, design a targeted intervention, and evaluate it. Directed patrol is the one tool that requires no analysis to deploy. This suggests that, without accessible pathways to existing evidence, much of American policing defaults to tradition and visibility rather than choosing them.
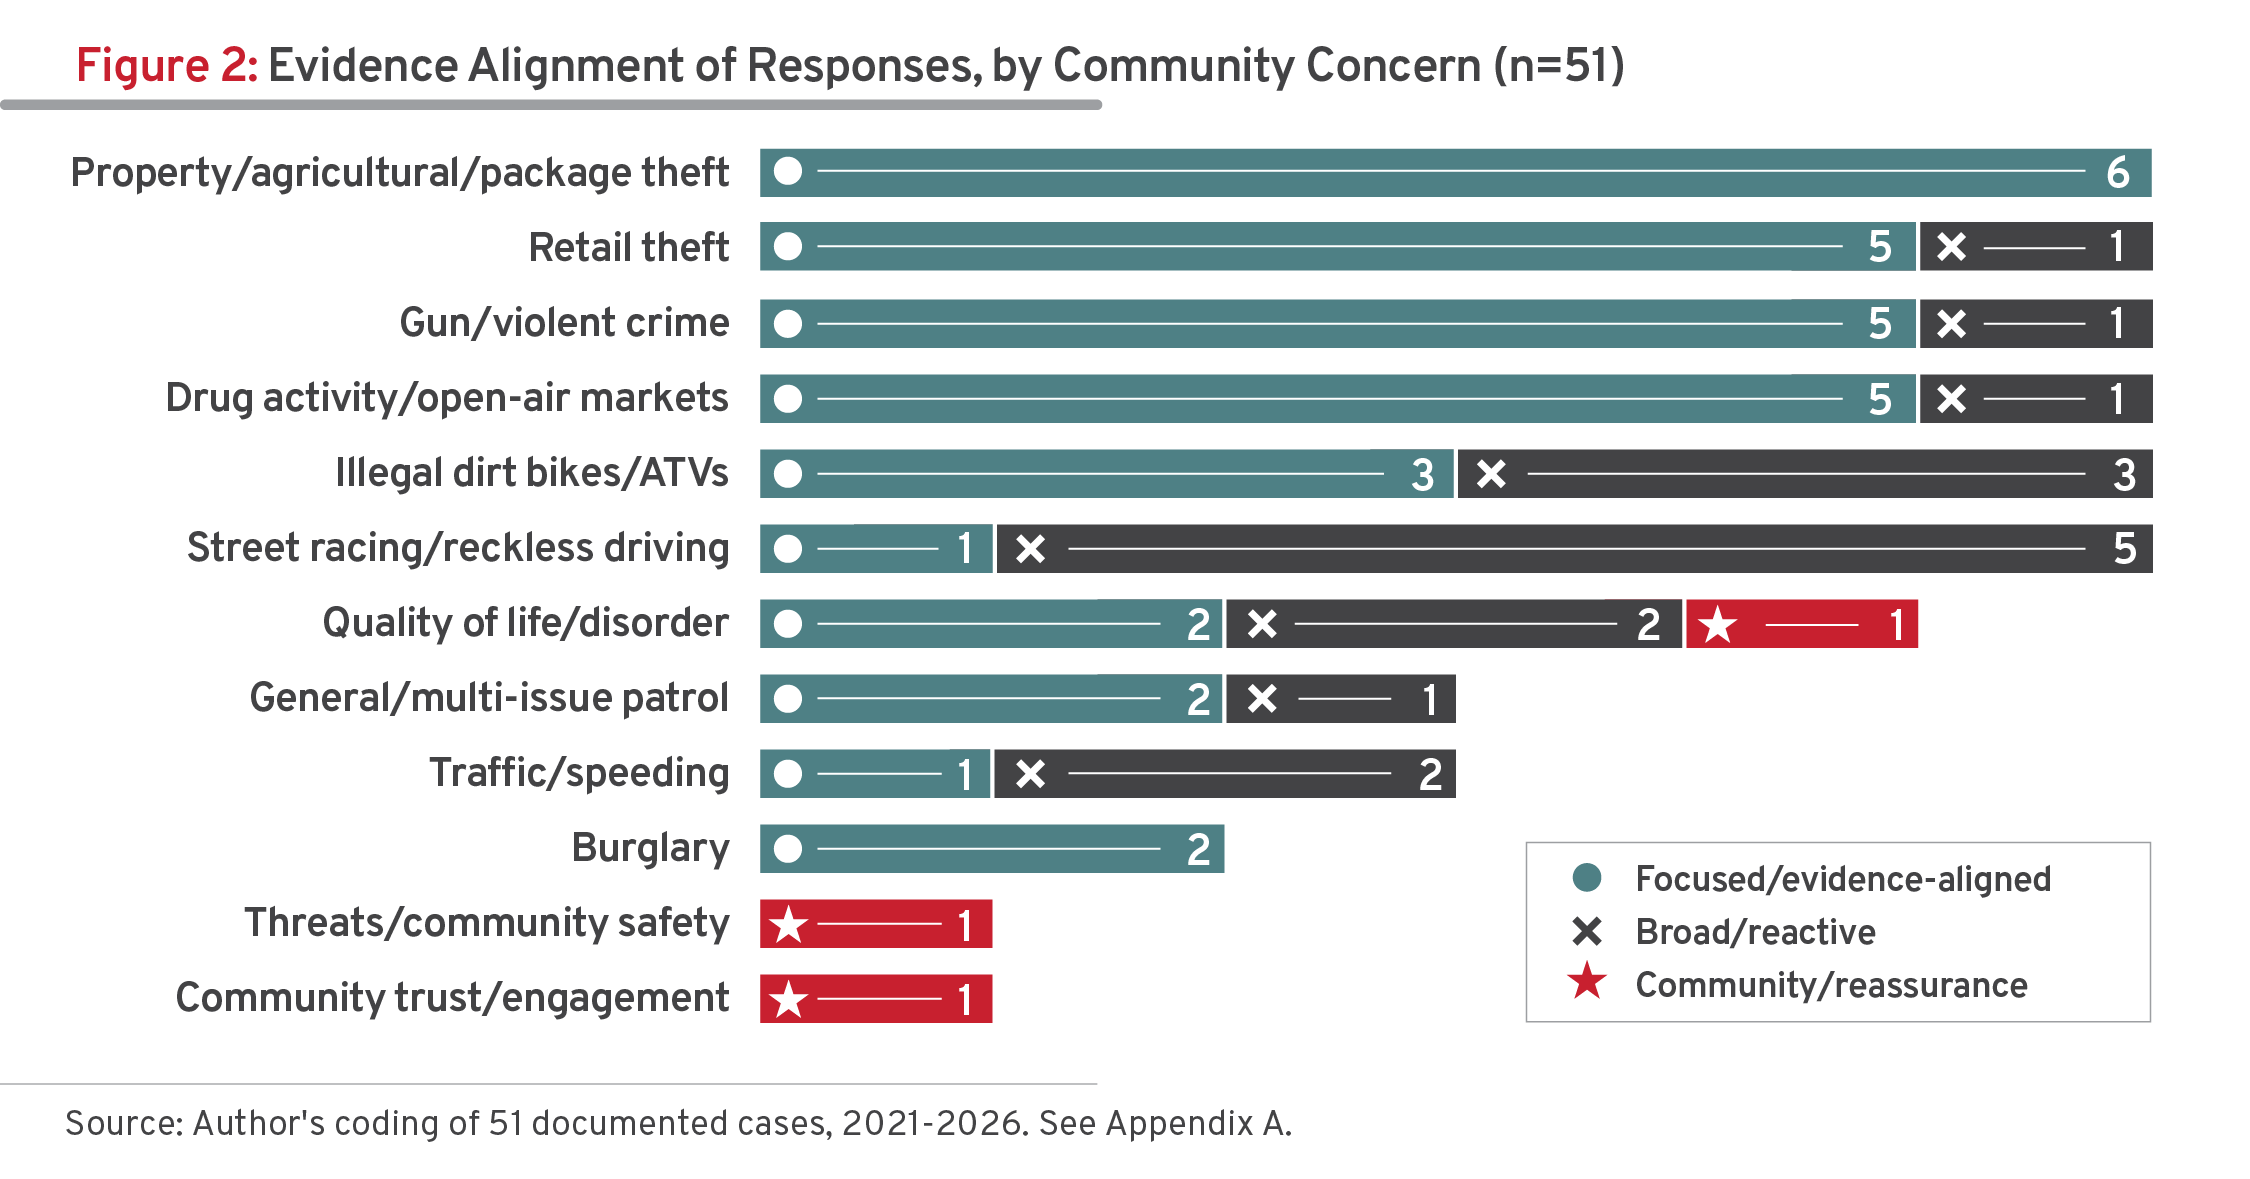
The pattern sharpens when the same cases are sorted by the concern that prompted them (Figure 2). Five of the six street-racing cases, two of the three traffic cases, and half of the dirt bike and all-terrain vehicle cases (ATV) were met with broad or reactive enforcement. These were also the cases in which the cited sources described the most public pressure, including neighborhood protests and persistent resident complaints. Theft, drug-market, and gun-violence concerns drew the most focused work. Every property-theft case and five of the six cases involving drug markets, gun violence, and retail theft received a focused, evidence-aligned response. Because the set includes only concerns that prompted a documented response, it cannot show which problems generate complaints most often. Within these 51 cases, however, the problems that generated the most public pressure received the most visible enforcement, whether or not visibility is what the evidence recommends.
A third sorting asks what the agencies themselves counted as success (Figure 3). This coding does not evaluate whether the operations worked; a single announcement cannot support that judgment. It instead captures the strongest success claim each agency made in the cited source, using the four categories defined previously. The question it answers is what agencies report back to the public when they respond to community concerns. By that standard, genuine outcome measurement is nearly absent from the record.
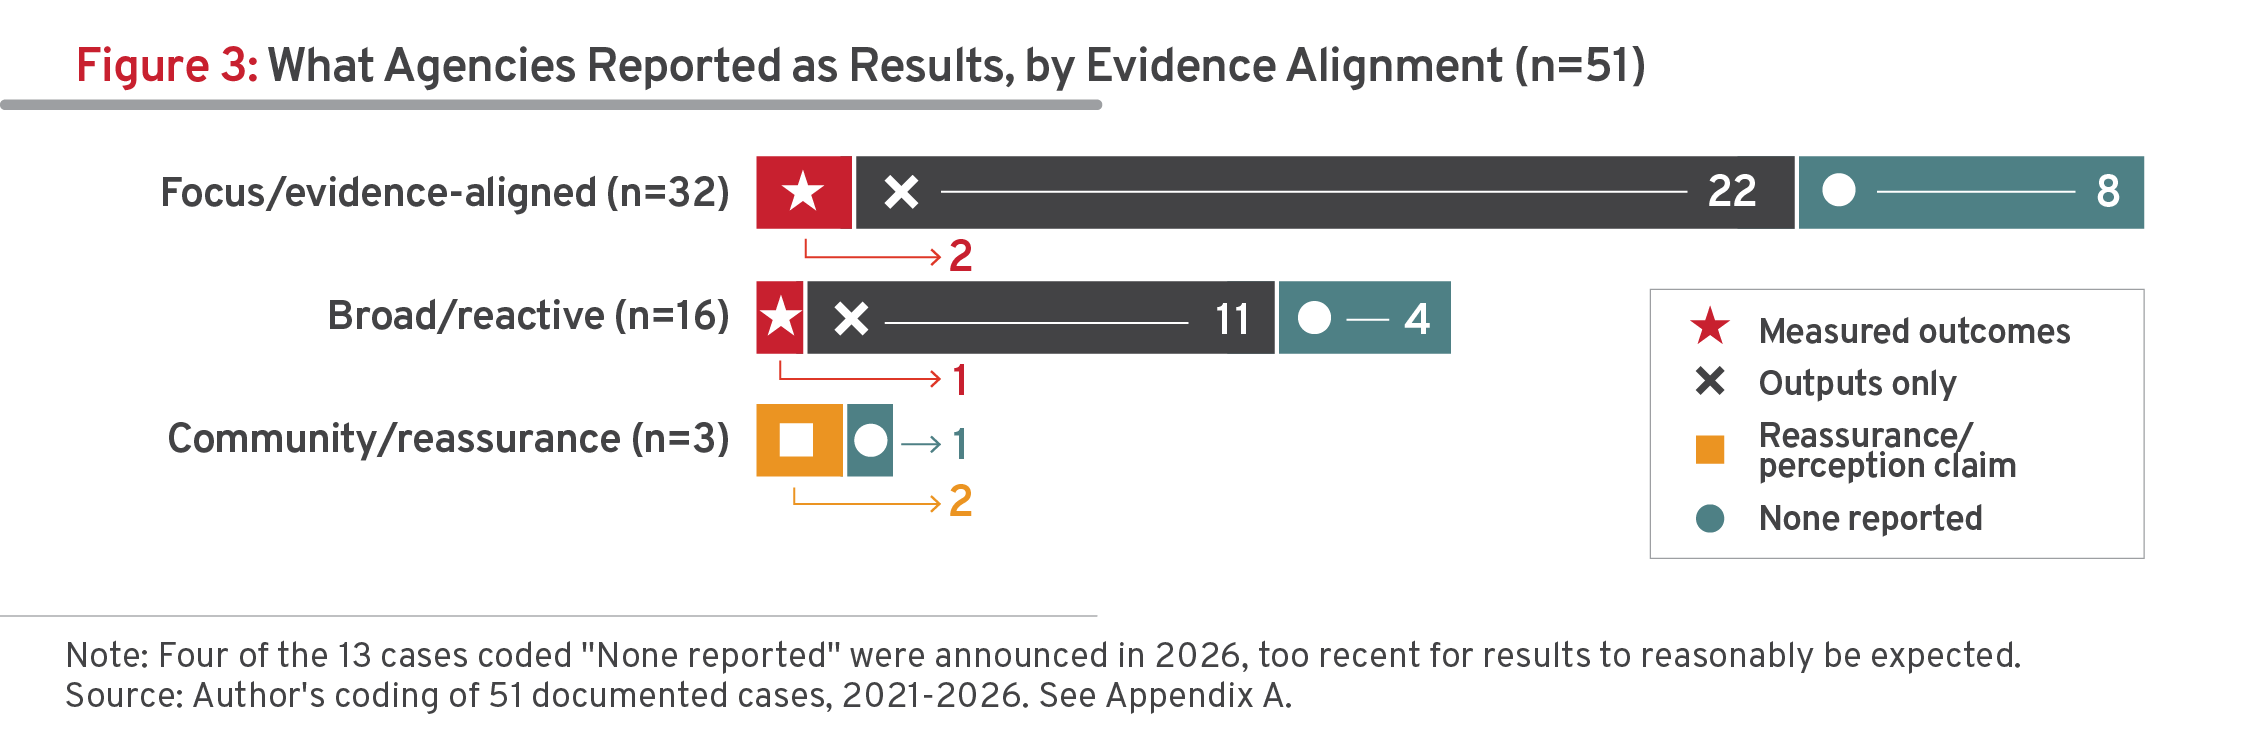
Thirty-three of the 51 sources reported outputs only, and another 13 reported no result of any kind; however, for four of the 13, the cited announcement was recent enough that results could not yet reasonably be expected. Only three claimed a measured outcome, all of which were agency or political claims rather than independent evaluations: New York City’s assertion that shootings fell on the pilot blocks of its “Every Block Counts” initiative, Massachusetts officials’ statement that a statewide takeover surge was followed by a weekend with zero street takeovers, and Greenwich’s report that school-zone speeding violations fell 92 percent once its camera program began issuing citations. The remaining two cases, both community-oriented programs, defined success as reassurance itself.
Figure 3 also shows that arrest counts are how agencies claim success to the public regardless of the strategy used. Outputs dominate the focused operations (22 of 32) as thoroughly as the broad ones (11 of 16), and the three largest single-operation arrest totals in the set (244 arrests, roughly 90, and 83) all came from broad, reactive sweeps. The practice of equating arrests with success runs deep enough to blur the language of evaluation itself. Humboldt County’s announcement claimed “measurable results” and evidenced them entirely with a list of arrests; a Bureau of Alcohol, Tobacco, Firearms and Explosives (ATF) announcement titled as an “outcome” reported only outputs; Memphis defined its operation’s goal in outcome terms and its purpose as reassurance yet reported neither. The contrast between two retail-theft cases is instructive. San Ramon reported systematic, program-level enforcement data from its grant-funded suppression team, while Louisville announced an 83-arrest total from a two-day blitz. Of note, where genuine outcome evidence exists for these operations, it consistently lives outside the announcements coded for this study. In Milwaukee’s case, an external academic evaluation; in Anne Arundel County’s, a separately claimed decline in crime attributed to its Real-Time Information Center; in New York’s, the Quality of Life Division separately publicized response-time data. The outside record can also cut the other way. San Francisco announced nearly 90 arrests from its Jefferson Square Park operation, but follow-up reporting found that most of those arrested faced a single misdemeanor loitering charge, that no felony drug-dealing charges resulted, and that the lone felony prosecution to emerge from the raid ended in acquittal. Agencies can measure results; the announcements through which they answer community concerns are simply not built to carry them. What residents hear back, when they hear anything at all, is a count of enforcement activity, which proves effort rather than effect.
From Complaint to Deployment
No single initiative captures the conversion of complaint into deployment more clearly than the New York City Police Department’s (NYPD) Quality of Life Division, launched in April 2025. The division consolidates community-oriented officers into teams that respond specifically to non-emergency 311 complaints (e.g., noise, illegal parking, outdoor drug use, aggressive panhandling), precisely the visible disorder that drives people’s perceptions of safety. Its most telling feature is Q-Stat, a data system modeled directly on CompStat, the department’s crime-tracking apparatus, but trained on 311 quality-of-life data rather than crime data. In its first 60 days, the pilot teams answered more than 7,500 such calls, issued over 6,100 summonses, and cut average non-emergency response times by more than 16 minutes. The complaints the division answers describe real conditions, which is precisely why the initiative belongs in a study of perception. Research on fear of crime has long found that visible disorder of exactly this kind can generate as much fear as crime itself by shaping residents’ sense of how risky their surroundings are. A department that manages disorder with CompStat-style accountability is therefore managing the conditions under which residents form their sense of safety. However, what Q-Stat measures is the complaint stream and the department’s response to it. Whether the effort makes residents feel safer is a separate, testable question, and the reported figures—calls answered, summonses issued, response times—do not yet answer.
The division’s design is not without controversy; critics note its lineage in the broken-windows theory of disorder and its enforcement of low-level violations. The evaluation literature offers a useful guide: A systematic review of disorder policing finds that community and problem-solving approaches to disorder produce meaningful crime reductions, while aggressive order-maintenance enforcement does not. But whatever one concludes about the tactics, the institutional logic is striking. A major agency has taken the conditions most closely tied to how safe residents feel and made them a tracked, managed, command-accountable priority, governed with the same data discipline long applied to crime.
The documented cases show the same logic operating at every scale. In San Francisco, repeated resident complaints about open-air drug activity led to an overnight operation that arrested nearly 90 people at a park. In Baltimore and Philadelphia, departments created dedicated enforcement details to seize illegal dirt bikes and all-terrain vehicles, which account for a fraction of serious harm but generate an outsized share of quality-of-life complaints and viral video. In rural Nebraska, in response to a run of copper-wire and equipment thefts, a county sheriff publicly concentrated patrols on the overnight and early-morning hours, framing the move as a direct answer to residents who felt their property was unprotected. The places and problems differ, but the sequence is the same: community concern prompts an enforcement response.
The response side of that sequence is as varied as the concerns that trigger it. When residents of Meriden, Connecticut, complained repeatedly about narcotics sales from a single home, the department answered with a targeted investigation, not a neighborhood sweep, ending in a search warrant at that address. In Winston-Salem, North Carolina, police and the ATF answered concerns about gun violence with a 90-day ballistics-intelligence initiative, using cartridge-casing matches to concentrate enforcement on a small set of shooters connected to multiple crimes. Suburban San Ramon, California, met a post-pandemic rise in organized retail theft with a grant-funded, data-driven suppression team paired with community education, and published its results. Some responses aim squarely at reassurance: the Maricopa County Sheriff’s Office increased patrols around places of worship after similar threats were reported elsewhere in the country, and Raleigh’s Cops on the Block program assigns officers to specific blocks for sustained engagement. Each is a different instrument—warrant, ballistics network, data-driven detail, visible presence. In the first three cases, the concern named a real, documented crime problem; in the last two, the concern was closer to fear itself. All five entered the system the same way, as a resident-reported concern the agency chose to answer in the way it thought best. The individual cases appear in Appendix A.
How Misalignment Distorts Public Safety Priorities
If public perception reliably drives how agencies deploy and enforce, then the gap between what people believe and what the data shows does not stay contained to public opinion. It reaches every stage of the public safety system: deployment, investigation, the workforce, the categories of crime that command attention, and the politics of what happens after a sentence. Each stage absorbs the distortion differently, and each compounds the others.
Deployment and Strategy
Misalignment between public concern and measured crime affects deployment in three ways: it diverts officer time from places where harm concentrates, it pushes agencies toward their broadest and least effective tools, and it corrupts the data that newer deployment technologies depend on.
Officer time is finite, and complaint volume is an imperfect guide to where serious harm occurs. When the two diverge, an hour of saturation patrol where complaints are heaviest is an hour not spent on the small number of people and places that drive the most serious violence. Decades of research point toward targeted strategies, with hot-spot policing, focused deterrence, and problem-oriented approaches showing consistent association with crime reduction. The strength of that evidence varies by the type of crime each strategy targets—focused deterrence has been tested mainly against gang and group violence, while researchers have evaluated hot-spot and problem-oriented approaches across a wider range of crimes and disorder problems. The research therefore suggests agencies should match the strategy to the problem it seeks to address.
However, doing so requires diagnosing the problem first, but diagnosis is more difficult than it appears. Even among agencies that embrace problem-oriented policing, researchers describe practitioners conducting cursory analysis and then reverting to familiar enforcement tactics, and surveys find that only about one-third of U.S. departments actively encourage problem-solving projects. The strongest practice pairs a diagnostic lens with intelligence-led work; one asks why a problem persists, the other asks who drives it.
The second misalignment is a drift toward visibility over effectiveness. The cases documented in this study show how easily that drift occurs: saturation or directed patrol—the broadest and most visible tools—formed the single most common response to community concern. Yet enforcement volume alone does not produce results. The NYPD cut civilian stops by more than an order of magnitude after 2013 while crime continued to fall, a pattern that challenges the assumption that simple police-contact volume drives crime reductions; instead, research points toward the efficacy of targeted enforcement and place-based strategies, while suggesting indiscriminate stops undermine those strategies. The finding is an old one. More than 50 years ago, the landmark Kansas City Preventive Patrol Experiment found that varying the level of routine motorized preventive patrol had no significant effect on crime, fear, or citizen satisfaction—a finding that helped launch the modern search for more targeted strategies. Subsequent studies of the “standard model” of policing, which spreads resources thinly and reactively across a jurisdiction, reached the same conclusion: What police do, and where they do it, matters more than how visible a presence they generate. Deterrence research reinforces the point: Increasing the certainty of apprehension by concentrating law enforcement resources on the right people and the right places more reliably interrupts offender behavior than relying on general visibility or increasing the severity of anticipated punishment. Police executives increasingly say the same, crediting agency leadership that concentrates limited resources on the small number of individuals responsible for a disproportionate share of offenses. Officer visibility can reassure community members, and reassurance is a legitimate goal. But political pressure can also drive the demand for visible action. Leaders under intense public scrutiny may feel pressure to demonstrate immediate action—a new task force, a crackdown, a press conference—and a department can adopt the vocabulary of evidence-based policing while continuing to deploy resources according to tradition, political pressure, or crisis response.
Finally, even the newest deployment tools can absorb the same distortions. The most effective predictive policing approaches tend to combine transparent, theory-driven risk terrain modeling for location data with focused deterrence for individual-level information; nontransparent commercial forecasting products and enforcement-only watchlists have repeatedly failed rigorous evaluation. Importantly, predictive systems learn from records that reflect where police have looked and where people have reported crime, not where harm objectively occurs. A perception-driven data stream can therefore become tomorrow’s deployment map, creating the appearance of objective analysis while reproducing the biases and gaps in the underlying data. For this reason, the quality of the perception-based information that feeds the system becomes a public safety variable in its own right.
Clearances and Investigative Capacity
Misperception of public safety can also erode the investigative function on which accountability depends, as investigations run on public cooperation, and that cooperation depends on what people believe about crime and the police. Even in a year of record crime declines, agencies cleared only about 47 percent of violent crimes and 17 percent of property crimes in 2025. Clearance is the visible end of a longer attrition; only about 48 percent of violent victimizations were reported to police in 2024, meaning a large majority of crime never enters the system at all. Both reporting and clearance depend heavily on community cooperation—victims who come forward, witnesses who speak, residents who trust police enough to share what they know. The research is explicit on the mechanism: People cooperate with legal authorities they regard as legitimate, and legitimacy is built largely through the perceived fairness of police behavior. When the public believes crime is rampant and the system is ineffective, cooperation with police contracts, and investigative capacity contracts with it. That cooperation is fragile for other reasons, too. A January 2026 preview of the year ahead relayed chiefs’ and sheriffs’ concerns that stepped-up federal immigration enforcement was making some residents afraid to report crime at all, a reminder that reporting behavior responds to perceptions of the entire system, not only of crime itself.
The link runs in both directions. In recent surveys of high-homicide Chicago neighborhoods, residents were more willing to cooperate in homicide investigations where police solved more murders and where residents believed they did. Community-oriented policing is the strategy that treats cooperation as its central aim. Systematic evaluations find its direct effects on crime modest and mixed, but its effects on residents’ satisfaction with police and perceptions of legitimacy are consistent and significant. Procedural-justice research ties those perceptions to the behaviors that close cases: reporting crimes, serving as witnesses, and sharing information. Recent research also suggests that recorded crime may understate community policing’s benefits: stronger police-community relationships make people more willing to report offenses they once kept quiet, so recorded crime can rise in engaged areas even as victimization falls.
Investment in investigative practice itself also pays measurable returns. When the Boston Police Department applied a problem-oriented approach to its homicide investigation practices, clearance rates improved significantly relative to comparison trends. Cooperation and capacity thus reinforce each other, and closing the gap between public perception of crime and actual crime is critical to both: it encourages reporting, which feeds investigations, which produces the clearance rates that sustain public confidence.
Workforce, Recruitment, and Training
A distorted crime narrative does not just affect where police deploy and the degree to which crimes can be solved; it also affects whether agencies can recruit and retain the workforce needed to respond to crime effectively. Prospective law enforcement candidates and serving officers respond to how dangerous the job appears and to how they believe the public regards them. A public narrative of unrelenting danger and hostility toward police slows recruitment, accelerates attrition, and erodes the morale of officers. The result is a staffing emergency that itself degrades service quality and response times. National survey data confirms this. Agencies reported staffing losses of roughly 5 percent between January 2020 and January 2023, and although hiring has since recovered slightly, staffing in 2024 remained below pre-pandemic levels. The costs of suboptimal staffing are not merely administrative; they have real effects on serious crime, which means perception-driven staffing declines carry a measurable public safety price. The issue compounds itself. Agencies that are short-staffed due to perception-driven declines are less able to deliver the focused, well-trained enforcement that reduces crime; and short-staffed agencies are forced to triage and lean harder on broad, visible patrol over patient, investigative work, which deepens exactly the misallocation described above. A workforce struggling to keep up because of a distorted public narrative cannot easily produce the results that would correct it.
Retail, Targeted, and Signature Threats
Some offenses carry symbolic weight far beyond their statistical footprint, and organized retail crime is a recent example of public concern and policy response outpacing the available evidence. In 2022, the National Retail Federation estimated that organized retail crime accounted for nearly half of the roughly $94.5 billion in annual retail “shrink”—the industry’s term for inventory losses from theft, fraud, damage, and error. That estimate helped drive a wave of national alarm and legislation, as well as corporate action to better protect store merchandise or close stores. In late 2023, the organization retracted the claim, acknowledging that it had been mistakenly inferred from older Senate testimony that referred to total shrink, not organized theft. This example illustrates this study’s thesis directly: A dramatic and memorable number shaped the agenda long after the data no longer supported it.
The retraction did not settle the question, however. An independent analysis found that shoplifting rose significantly in 2024 even as nearly every other category of crime fell, making it one of the few offenses moving against broader downward crime trends. That combination makes retail crime difficult to calibrate; it is a genuine, visible, locally felt problem, but it can also become a vehicle for inflated claims and disproportionate policy attention and resource allocation.
Downstream Effects
The same distorted crime narrative that shapes deployment also reaches the end
of the continuum, where its effects are least visible and most difficult to reverse. The back end of the justice system—everything that governs what happens after
an individual is sentenced—is perennially vulnerable to fear-driven shifts.
Surges in public concern about crime have fueled backlash against policies perceived as lenient for decades. In 1987, after a Massachusetts man on furlough committed a brutal home invasion, the state abolished its furlough program. A presidential campaign ad the next year turned his case into a national symbol, and the politics of release hardened for a generation. This dynamic persists today. In the past several years, New York amended its bail law three times amid sustained coverage of individual release failures, yet when researchers examined data on the reform, they found that the original iteration had reduced overall recidivism in New York City.
The research consensus is that stable reentry support reduces reoffending and that incarceration beyond a certain point yields diminishing public safety returns. Sanctions-focused research similarly shows that custodial sentences do not reduce reoffending relative to community-based alternatives. The public perception gap—and its corresponding call for harsh sentences—thus threatens precisely the evidence-based, cost-effective programs that help formerly incarcerated individuals succeed and keep communities safe over the long run.
Fortunately, there are signs that the public is open to a better balance. In Gallup’s 2025 crime survey, respondents as a whole leaned toward directing government funds and effort at the societal problems that lead to crime rather than solely toward expanding enforcement. Protecting that work holds the back end of the system to the same standards as the front. It also prioritizes evidence over the news cycle.
Treating Perception of Crime as a Core Public Safety Domain
If public perception of crime drives law enforcement resources, deployment, cooperation, staffing, and downstream policy, then it deserves to be measured and managed with the same rigor as crime itself. For most of the modern era, agencies have tracked offenses, arrests, and clearances in granular detail but have not tracked public perception of crime in the same way.
The most promising management approaches close that gap. New York’s Q-Stat is one example. It brings the visible-disorder conditions that research links to residents’ sense of safety—in this case 311 quality-of-life complaints—into the same command-accountable management cycle long used for crime, complete with regular review meetings and named accountability for results. That structure has already produced one measurable service outcome: the 16-minute improvement in non-emergency response times noted earlier. Whether faster response also reduces fear is precisely the question that tracking perception metrics would let the department answer.
National research on CompStat (i.e., the NYPD’s crime-tracking system) documents how a data-driven accountability cycle tracking crime metrics spread rapidly through American policing because it gave commanders a clear way to manage toward measurable outcomes. The same could happen with perception-related metrics, as the underlying principle of managing toward measurable outcomes is versatile. It could be applied to small or large departments, it can track a small or large set of metrics, and it can track metrics related to public perception of crime alongside crime and clearance data. By measuring perception-related metrics like fear, perceived safety, confidence in police, and the volume and location of quality-of-life complaints with other more standard metrics, departments could prioritize the neighborhood’s sense of safety as a managed outcome rather than as an afterthought. Importantly, fear of crime and perceived risk are related but different concepts. Fear is an emotional reaction; perceived risk is a person’s estimate of how likely they are to be victimized, and the two can move independently. A resident can judge their own odds of victimization to be low and still feel unsafe walking at night. Survey questions that blend crime and fear together produce results that are difficult to interpret and even more difficult to act on. For this reason, survey questions related to fear and perception must be crafted carefully and with intended outcomes in mind. Validated questions on these topics already exist, and agencies that want to begin tracking such metrics can look to those.
Perception is movable with action and information. Routine car patrol, as the Kansas City experiment showed, does not change how people feel; visible and sustained reassurance—in the form of foot patrol and direct community contact—does, reducing residents’ fear even when it does not change the underlying crime rate, a finding that dates back to the foot-patrol experiments of the early 1980s. The reassurance benefit does not come at the expense of crime control. A controlled trial in Philadelphia found that concentrated foot patrol reduced violent crime in the hot spots where it was deployed. Giving the public accurate, local, and timely crime data can narrow the gap between what people believe about their own communities and what is accurate. It can also help them better resist the pull of the national fear cycle. The overall aim of moving public perception with these types of efforts is to ensure that opinions, and the policies they drive, rest on an accurate picture of where people are safe and where they are not.
From Evidence to Practice
Five decades of research on policing strategies point to a consistent conclusion: Focused, well-diagnosed, community-engaged strategies reduce crime, while broad and undifferentiated enforcement rarely does. Because the strategies that address community concern are often the same strategies that reduce harm, a department does not have to choose between responsiveness and effectiveness. Those approaches are well documented and, in many cases, no more expensive than the tactics they would replace.
Focused strategies, however, demand analytic work that directed patrol does not require. An agency has to identify where local harm concentrates, design a targeted response, and be prepared to evaluate the effectiveness of its response. As a result, small, capacity-constrained agencies can drift toward traditional, visible strategies—not because they reject evidence but because most lack the analysts, partnerships, and evaluation budgets needed to gather and apply it. When agencies have that capacity, they are better positioned to match resources to actual harm. Place-based policing succeeded in New York because it was precise, concentrating resources on the small number of locations generating a disproportionate share of harm. Problem-oriented and intelligence-led strategies add the diagnostic discipline needed to preserve the precision of a planned response; the former asks why a problem persists, the latter who is driving it. Community-oriented policing helps build the legitimacy that makes focused enforcement acceptable to the neighborhoods that receive it. Newer predictive tools bring the same calibration problem into the data layer. If those systems are trained on records of where police have been dispatched and where complaints have clustered, they can embed public alarm into future enforcement priorities. Taken together, the evidence suggests that strategies that reduce crime are also the best strategies to close the gap between what communities fear and what actually threatens them.
Even when agencies have evidence to support a strategy, public perception of crime can influence whether they have the political support to move forward with them. Focused strategies are often less visible than saturation patrol, and when the public measures police effectiveness by visibility alone, agencies feel pressured to use visible tactics the research rates as less effective. Thus, managing public perception as its own domain is not separate from evidence-based policing; it is part of what makes evidence-based policing politically sustainable.
Key Recommendations
The following recommendations identify practical steps stakeholders can take to close the perception gap. They share a common premise: Government is more effective when it aligns attention and resources with evidence rather than with alarm.
For Legislators and Legislative Staff
Public fear reaches lawmaking through two channels: budgets and the substance of criminal law. Both channels require the same discipline.
- Anchor lawmaking in harm. Anchor both appropriations and statutes in evidence of harm, victimization, and results—not in the salience of crime in a given news cycle. Treat public perception as a legitimate policy concern (i.e., something to measure, report on, and respond to) without letting it substitute for harm data in deciding where money goes or where statutory attention is focused.
- Build budgetary patience in both directions. Fund the less-visible building blocks of long-term safety: investigative resources, crime-data systems, and workforce stability efforts. Keep them funded when fear recedes, and treat sustained low crime as a result that warrants continued support to ensure that successful, proactive agencies are not penalized. Extend the same patience to the reentry and prevention programs most exposed to cycles of public alarm and fading attention.
- Legislate deliberately. Before legislating in response to a viral incident, ask whether the underlying problem is truly emerging from the data or rising only from heightened public attention, and require independent confirmation of any specific claims of loss or harm before allowing them to influence statute.
For Law Enforcement Executives and Associations
- Adopt perception as a tracked domain. Build or borrow a Q-Stat-style review cycle that examines fear, confidence, and quality-of-life complaints alongside crime and clearance data, and weigh saturation and reassurance tactics against what they may divert from focused, evidence-based work. Treat procedural fairness in everyday encounters as a perception strategy. Systematic reviews find that interactions led by procedural fairness improve residents’ views of police legitimacy, and survey research shows that negative encounters damage confidence far more than positive encounters build it.
- Report outcomes rather than activity. Pair every high-visibility response to community concern with an investment in investigative capacity, and communicate local results—and outcomes—plainly so that residents sense progress. In the enforcement actions documented in this study, agencies rarely told the public whether the problem actually improved: 33 of the 51 cited sources reported only arrest, citation, or seizure totals, and only three claimed a measured outcome (Figure 3). Building even simple before-and-after data reporting into operational announcements (e.g., calls for service, repeat complaints, crashes, or shootings on the affected blocks) would convert the same press release from proof of effort into evidence of effectiveness.
For Business and Retail Stakeholders
- Partner with agencies on targeted data-sharing responses to organized retail and property crime and be precise in public communication. The retail sector’s own experience with inflated loss figures is instructive. Distinguishing genuine, measured threats from isolated incidents protects both the credibility of legitimate concern and the efficient direction of public resources. Several of the cases discussed in this paper show what a partnership model looks like in practice, pairing shared data and dedicated analytic capacity with enforcement aimed at repeat offenders rather than blanket sweeps. Accurate data is the foundation of a response that works.
For Public Safety Philanthropic Funders
- Fund measurement infrastructure and multiyear public safety work. Government funding for public safety tends to track the public mood, and the organizations that work alongside law enforcement agencies, courts, and reentry systems are often the first to lose support when attention moves elsewhere. Where government funding is absent or unreliable, sustained philanthropic investment can help ensure that public safety continues to be guided by real crime data rather than by perception alone. Priorities should include measurement infrastructure, such as local crime dashboards, perception surveys, and rigorous evaluation, as well as the multiyear support that allows effective programs to survive shifts in the news cycle.
For Federal Crime-Data Agencies
- Produce more timely, complete, and comparable national crime data, and present it in forms the public and the press can readily use. The years in which the nation’s two principal crime measures appeared to differ undermined public confidence, and researchers have documented how difficult those divergent signals were for even attentive observers to interpret. Reconciling and speeding that data would help close perception gaps. The faster and clearer the official signal, the less room there is for fear to drift from reality.
For Media Professionals
- Pair individual crime coverage with base rates and trends, label local versus national context explicitly, and treat the persistent gap between perceived and actual crime as a story worth telling accurately. The stakes of coverage choices are well documented. Crime is among the most consumed forms of local news, and the people most attentive to it express the greatest concern about it. Coverage that situates a shocking incident within the larger trend informs without distorting, and over time, helps rebuild the shared factual ground on which sound public safety policy depends.
Conclusion
The United States has recorded a meaningful, sustained decline in crime, achieved in part through the focused, evidence-based work of the law enforcement agencies examined in this study. Yet for most of the past two decades, the public did not believe it. That crime perception gap shapes every stage of the system. It misallocates resources, erodes the cooperation that solves crimes, depresses the workforce, and endangers the downstream programs that keep gains durable. Closing the gap between perception and reality is therefore a critical public safety strategy, and the work cannot fall to police alone. It calls for a cross-sector effort by legislators, law enforcement, businesses, philanthropies, federal data agencies, and the media to measure public perception and manage its effects on public safety.
The current moment offers a rare opportunity—crime rates are falling, crime data is steadily improving, and public fear is finally beginning to ease. Together, these conditions make it possible to institutionalize the strategies that produced the decline and to bring public belief into line with the evidence before the next cycle of alarm reopens the gap. That work is within reach.
 Loading…

 Reload document
  Open in new tab
Loading…
Open in new tab
Loading…