Have we reached peak inflation?
Today’s release of April figures for the Federal Reserve’s preferred inflation indicator—the personal consumption expenditures price index (PCE), excluding food and energy—showed another increase in the 12-month rate. After showing year-over-year increases of 1.5 percent in December, January and February, the index was up 1.8 percent in both March and April.
Are we approaching the Fed’s longstanding goal of 2.0 percent for this “core” figure? Will there be a “symmetrical” overshoot of the target? Is inflation taking off after years of stimulative monetary policies? Has the Phillips curve been resuscitated from the dead?
None of the above.
The Dollar’s Effect on Inflation
Short-term fluctuations of inflation figures are largely due to changes in the dollar’s foreign exchange value. Just as inflation is the change in a price level between today and the past, understanding the dollar’s impact is facilitated by looking at changes in the dollar’s current value compared with its recent past average.
Since many global commodities are priced in dollars, changes in the dollar’s value impact global supply and demand, often producing a change in commodities’ dollar pricing, which then affects inflation. Similarly, import price changes affect domestic U.S. prices for competitive goods and services.
The dollar’s influence on U.S. prices is evident in the producer price index (PPI). In the middle of 2015, the PPI declined by more than 5.0 percent from 12 months prior, and the dollar was 15 percent above its trailing three-year average. As of March 2018, the dollar was 5 percent below its average, and the PPI shot up to a 3.9 percent 12-month rate. The dollar’s value alone explains more than 50 percent of PPI fluctuations, as represented in Figure 1.
FIGURE 1: Producer Price Index vs. Trade-Weighted USD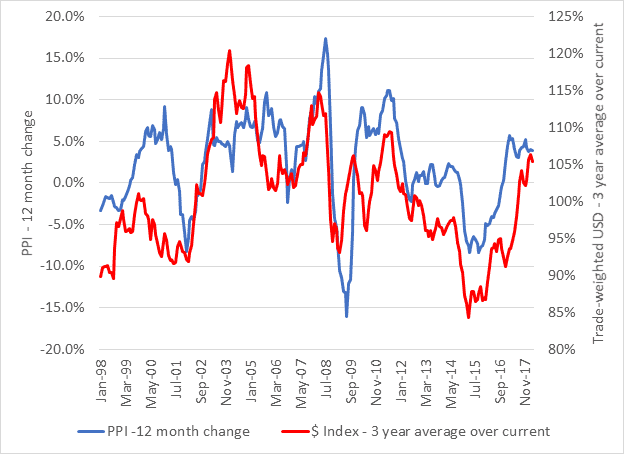
NOTE: Measuring the dollar’s current trade-weighted exchange value against its recent three-year average explains more than 50 percent of the PPI’s fluctuations.
Naturally, with such a strong effect on producer prices, the dollar’s value will be reflected in broader prices measured by the personal consumption expenditures (PCE) price index. Headline PCE inflation, including food and energy, with its large commodities component, is especially sensitive to the value of the dollar. Again, in mid-2015, PCE prices increased just 0.2 percent over 12 months with the dollar up, while in March and April they rose at 2.0 percent with the dollar down. Figure 2 illustrates how the exchange value of the dollar explains more than 40 percent of headline PCE price variability.
FIGURE 2: PCE Price Index vs. Trade-Weighted USD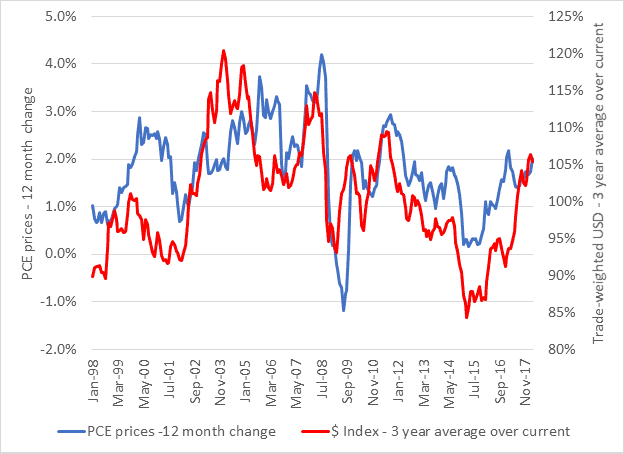
NOTE: Headline PCE prices have a large energy commodity component, making them sensitive to the dollar’s foreign exchange value which explains over 40 percent of their variability.
While headline PCE prices show major sensitivity to the dollar’s value, the core PCE price index, without food and energy commodity exposure, is less sensitive, which is one of the reasons the Fed prefers it as a more stable indicator of inflation trends. Nevertheless, the dollar has a significant effect on core PCE prices. In mid-2015, core PCE prices rose 1.3 percent, while March and April each saw a 1.8 percent increase, paralleling the dollar’s decline relative to its average. The dollar’s value explains more than 25 percent of core PCE price variability, as illustrated in Figure 3.
FIGURE 3: Core PCE Price Index vs. Trade-Weighted USD
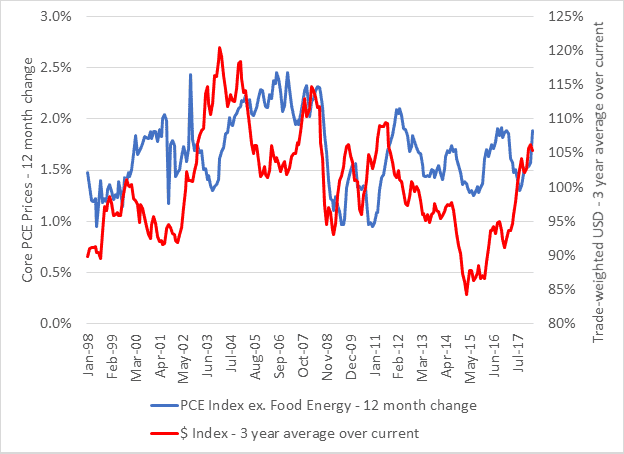
NOTE: Core PCE prices have less commodity exposure than headline figures but remain significantly sensitive to the dollar’s value which explains over 25 percent of their variability.
The Fed’s Targeting Problem
If the early 2018 run-up of inflation is due largely to the dollar’s decline, where does that leave the Fed’s quest for its 2.0 percent target? As depicted in Figure 4, since 1995, core PCE prices have failed to reach the 2.0 percent target on a sustained basis for all but a four-year period that coincided with the run-up to the financial crisis.
FIGURE 4: U.S. Core PCE 12-Month Inflation
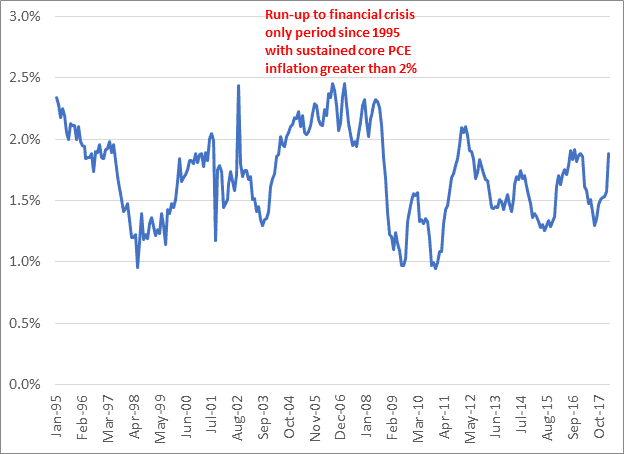
NOTE: In more than 20 years since 1995, the Fed’s 2.0 percent inflation target for core PCE prices has been exceeded for just a four-year period that coincided with the run-up to the financial crisis.
The Fed’s inflation shortfall thus appears far broader than just a legacy of the crisis, beginning as it does in 1995. Certainly, it is not for lack of trying. Through the various QE measures, the Fed increased its balance sheet by 20 percent of U.S. gross domestic product and, as Figure 4 suggests, got no inflation increase. Other major central banks—the Bank of Japan and the European Central Bank—had even larger relative increases in their balance sheet and similarly have failed to meet their 2.0 percent targets.
Diminishing Effect of Monetary Stimulus Upon Inflation
The minimal inflation impact from extraordinary monetary stimulus is evidenced in how the value of the dollar has changed, as measured by inflation benchmarks, compared with how the Fed’s balance sheet has grown. To derive the value of a dollar, we’ll use the Fed’s preferred measure, core PCE prices, with a value in December 2017 of 113.75 (2009 = 100.00), and divide the December 2017 figure by the index at earlier observations. For example, in January 2000, the core PCE price index was 84.24, so the value of a dollar then was $1.35 in today’s terms. Going back further, the core PCE index was 41.66 in early 1980, producing a value in 2017 dollars of $2.73 and so on.
Figure 5 illustrates how the value of a dollar measured with the inflation index has declined as the Fed’s balance sheet has grown.
FIGURE 5: Value of a Dollar vs. Federal Reserve Assets
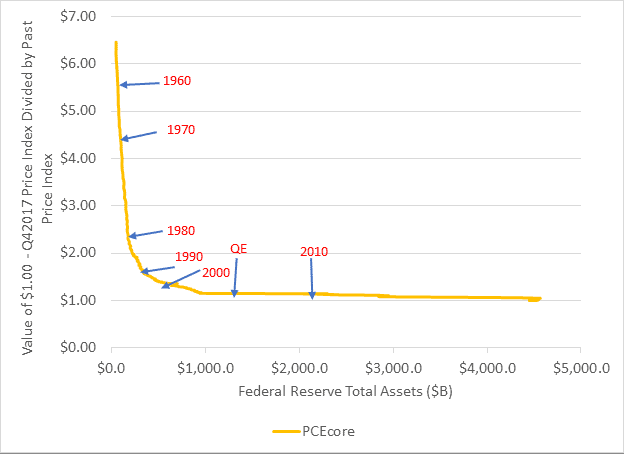
NOTE: Expressing inflation as a decline in the value of a dollar measured with the core PCE price index shows an initially steep decline in the dollar/increase in inflation beginning in the 1960s, which moderated around 1990, ultimately resulting in a situation today where an increase in the Fed’s balance sheet has a negligible effect upon inflation.
Figure 5 indicates changes in the Fed’s balance sheet had a very large impact on inflation in the 1960s through the 1980s; the dollar’s value fell 73 percent from $6.33 in 1960 to $1.71 at the end of 1989, coinciding with a 6.0 times increase in the Fed’s assets. The decline in value moderated in the 1990s and largely disappeared by the time of the financial crisis, explaining why the massive QE balance sheet increases had such little effect on inflation. At the beginning of 2000, the dollar was worth $1.38 and declined 28 percent by the end of 2017, while Fed assets grew 7.3 times.
It could be questioned whether the Fed’s balance sheet is too narrow a measure to judge the effect of monetary stimulus, but charts that use broader aggregates, such as M2, show the same effect. Much economic analysis of inflation evaluates potential influences, such as output gap and expectations, so again it could be questioned how much monetary aggregates actually affect inflation, but a technical paper finds variations in monetary aggregates explain virtually all the long-term variability of inflation when adjusted for the diminishing effect of monetary stimulus.
Outlook
If one can forecast the near-term track of the dollar, they may be able to know inflation’s direction. (Anyone accurately forecasting the dollar, please let the author in on it!) As of May 7, the Federal Reserve’s trade-weighted dollar index against major currencies stood at 88.21. Should it revert to its average for the last three years of 90.78, recent upward inflationary pressure should reverse on headline measures and likely on core measures as well, returning them near their long-term averages of 1.8 percent and 1.7 percent, respectively.
The Fed now has little effect upon long-term inflation. Its 2.0 percent target has rarely been attained in more than 20 years. The one such period was the run-up to the financial crisis, which raises concern about financial destabilization from attempts to exceed 2.0 percent for symmetry, never mind setting a higher, even more unattainable, inflation target, as some economists propose.
Image by Javier Crespo