
Measured Force: The Benefits of Police Data Transparency
Table of Contents
Media Contact
For general and media inquiries and to book our experts, please contact: pr@rstreet.org.
Executive Summary
For the past decade, policymaker and public attention has focused on police use of force like never before. Yet due to a lack of standardized data, the national debate on this sensitive topic has occurred largely in an information vacuum. Using interviews with active law enforcement personnel and other primary research, this paper explores the theoretical and legal framework for police use of force; chronicles the history of data-collection efforts; describes the current information and legislative landscape; and provides real-world examples of innovative data systems. We conclude with a series of recommendations to help law enforcement leaders and policymakers design use-of-force data systems and craft practical, evidence-based transparency laws.
Introduction
Successful policing requires the cooperation and trust of community members. The President’s Task Force on 21st Century Policing reported that “decades of research and practice support the premise that people are more likely to obey the law when they believe that those who are enforcing it have the legitimate authority to tell them what to do.” When tensions go unaddressed for too long, police legitimacy is undermined, leading to dangerous situations. Smoldering hostilities need only a spark—like the Rodney King verdict in 1991 or the killing of George Floyd in 2020—to ignite a conflagration of civil unrest. Of the 10 most destructive riots in United States history, more than half were prompted by incidents that involved excessive police force.
Although force is necessary in only a small percentage of police calls, it continues to be difficult to ascertain how often police cross the line from reasonable to excessive force. Before the Federal Bureau of Investigation (FBI) began collecting data in 2019, national estimates were based on local studies of individual jurisdictions, relying on a scattershot review of police reports, surveys, and media reports. In fact, in 2015, the director of the FBI called the lack of national information about police violence “embarrassing,” telling the House Judiciary Committee:
We can’t have an informed discussion because we don’t have data. I cannot tell you how many people were shot by police in the United States last month, last year, or anything about the demographic. And that’s a very bad place to be.
Aaron C. Davis and Wesley Lowery, “FBI director calls lack of data on police shootings ‘ridiculous,’ ‘embarrassing,’” The Washington Post, Oct. 7, 2015. https://www.washingtonpost.com/national/fbi-director-calls-lack-of-data-on-police-shootings-ridiculous-embarrassing/2015/10/07/c0ebaf7a-6d16-11e5-b31c-d80d62b53e28_story.html.
In the absence of official government statistics, even appropriate uses of force can be misconstrued, resulting in increasing tension and resentment between law enforcement agencies and the communities they serve. Today, mistrust of police is at an all-time high, driven by perceptions that violence is routinely misapplied and officers are seldom held accountable. Few other areas in public policy have such a wide delta between public discourse and available facts.
The antidotes to this problem are data transparency and open communication. Over time, this potent combination can build trust between communities and police by providing factual reference points to anchor productive dialog on sensitive issues. This type of data-driven culture is also crucial for agencies internally, as it can better inform decisions on procedures, training, tactics, equipment, and strategies for keeping officers safe. In addition, it can help identify problematic trends before they become systemic, allowing officers to learn from the mistakes—and successes—of their colleagues, as well as contribute to a higher degree of professionalism. This paper demonstrates that rigorous data policy is a critical but underused tool that promotes both public safety and law enforcement legitimacy.
Police Use of Force
Policymakers and police executives need to know how police are currently using force, how regulations shape behavior, and how training and culture influence officer decision making.
Theoretical and Legal Framework
Whether it involves breaking up a bar fight or returning fire at an active shooter, the legal authority to apply coercive force separates police from other government entities. Constitutional democracies like the United States’ must balance individuals’ interest in liberty with society’s interest in security, and police use of force runs counter to some of Americans’ most cherished ideals. Thus, on a purely philosophical level, monitoring and measuring police use of force against civilians is necessary to maintain the balance between public safety and civil liberty. From a more pragmatic perspective, the authority to use force carries with it the need for accountability, not only to safeguard the public, but also to preserve the integrity of law enforcement itself.
Police are expected to apply only the force necessary to resolve a dangerous situation and no more—a distinction that is not always crystal clear. However, the fundamental question for researchers, policymakers, and law enforcement leaders is straightforward: What proportion of police use of force is excessive? From a first-principles perspective, the standard used to analyze force is of tremendous practical importance in determining the data needed to answer this question. Four different standards must be considered: the constitutional standard, the state-law standard, the administrative standard, and the community standard. The first three each play a formal role in evaluating a given use of force and come with certain official sanctions or remedies. For example, an officer who violates an administrative regulation can be disciplined or terminated, and a violation of state or constitutional standards can result in civil liability or even a criminal conviction.
The community standard, however, is different. Violations of this standard do not result in formal sanctions, but they are the most relevant from a data-collection perspective, as transgressions can extend beyond a single officer or agency to reflect on policing itself as an institution. Even when a given use of force is deemed legitimate under constitutional, administrative, and state-law standards, it may still run afoul of community expectations. This was the case in the Rodney King incident that led to the Los Angeles riots in 1992.
There is a popular saying in the National Football League that relates to this idea: “Perception is reality.” That is, if you are perceived to be something, you might as well be it, because that is the truth in others’ minds. This is why, of all four standards, community expectations most directly influence public confidence in police. In the social media age, information is instantly transmitted around the country, magnifying the propensity toward confirmation bias. To keep pace with this new reality, cultivating positive police-community relations demands greater transparency than ever before.
What We Know About Use of Force
Although the data are not as robust as would be ideal, according to the best information currently available, police use of force is relatively rare. Regardless of the samples, measures, or analyses used, studies consistently conclude that most police encounters are peaceful interactions that do not involve coercion. Estimates suggest that, out of more than 50 million contacts with civilians every year, only about 1.8 percent involve a threat of or actual use of force. Even in the types of coercive interactions most likely to elicit resistance, such as the 13 million arrests that occur each year, force is necessary just 4 percent of the time, and most of these incidents involve low-level compliance techniques such as grab and holds. According to national FBI use-of-force data, incidents are trending down (Figure 1). In fact, these incidents have steadily declined over the past three years, and most U.S. law enforcement agencies report zero use-of-force incidents every month. A recent Bureau of Justice Statistics survey supports this finding, reporting that most residents who initiated police contact (88 percent) were satisfied with the police response, with only 1 percent reporting some type of misconduct. It is important to note that the FBI data is limited to the past few years and only includes uses of force that resulted in an injury. These deficiencies are discussed in more detail in the “Limitations of FBI and State Data Systems” section below.
Figure 1: Percentage of Civilian Contacts that Resulted in Use of Force Among All Participating Law Enforcement Agencies
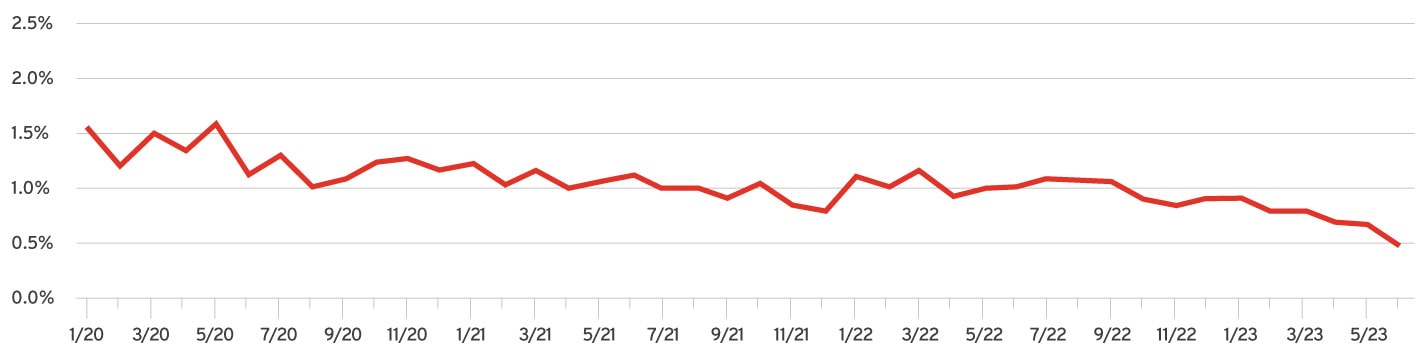
Source: “National Use-of-Force Data Collection: National 2023,” Federal Bureau of Investigation, 2023. https://cde.ucr.cjis.gov/LATEST/webapp/#/pages/le/uof.
Despite the decline in official use-of-force numbers, fewer Americans than ever are confident that police are adequately trained to avoid excessive force (Figure 2). The low level of public confidence, which dropped 15 percent since 2014, is likely related to the interplay between two cognitive biases: the availability heuristic and the illusory truth effect. The availability heuristic causes people to make subconscious judgments about the frequency of a phenomenon based on their awareness of similar events. In the aggregate, media coverage of police use of force focuses on the worst incidents of officer-involved shootings, brutal violence, and egregious misconduct, creating the false impression that use of force is more widespread than it is in reality. Repetition on the news triggers a second cognitive bias, the illusory truth effect, which makes people more likely to perceive repeated information as more truthful. Combined, these biases can lead citizens to conclude that the disturbing police violence seen scrolling through social media is the norm, even if that is not true statistically.
Figure 2: Confidence that U.S. Police Are Adequately Trained to Avoid Use of Excessive Force
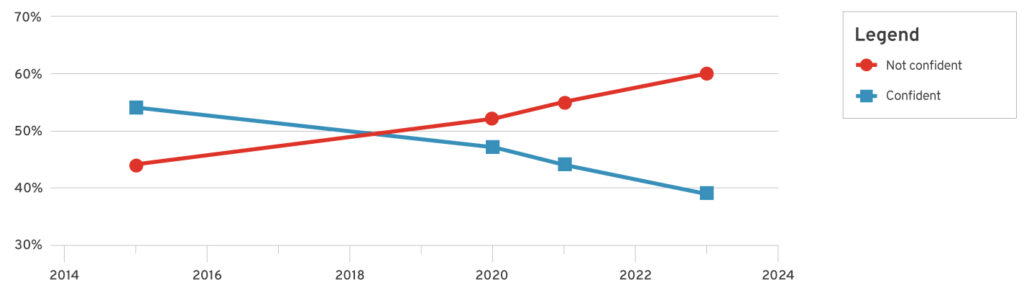
Source: “Jan. 27-Feb. 1, 2023, Washington Post-ABC News poll of 1,003 U.S. adults with an error margin of +/- 3.5 percentage points,” The Washington Post, Feb. 3, 2023. https://www.washingtonpost.com/ politics/2023/02/03/jan-27-feb-1-washington-post-abc-news-poll.
A Short History of Use-of-Force Data Collection
The quest to understand how police use force began almost a century ago, when President Herbert Hoover established the National Commission on Law Observance and Enforcement (known unofficially as the Wickersham Commission) to undertake the first comprehensive national study of crime, law enforcement, and criminal justice in the United States. The Commission’s 1931 report, titled “Lawlessness in Law Enforcement,” was a searing indictment of prohibition-era American policing, documenting widespread misconduct and abuse. Using blunt language, the report chronicled torture, cruelty, threats, and illegal detentions to extract involuntary confessions—a practice the authors referred to as the “third degree.” It was the first systematic investigation of police misconduct and became a catalyst for reforms involving new forms of accountability for American police.
In 1967, the President’s Commission on Law Enforcement and Administration of Justice concluded that police brutality was not as serious of a problem as it once was but conceded that they “lacked the data to definitively support that conclusion or identify patterns.”21 In 1981, the U.S. Commission on Civil Rights called on the FBI to collect data on violence and shootings involving police to create early warning systems.22 This recommendation was not acted upon in a meaningful way until 1994 when the Violent Crime Control and Law Enforcement Act required the Attorney General to publish an annual report on police use of force. Approximately a decade later, the Bureau of Justice Statistics’ (BJS) incorporated use-of-force questions into the Law Enforcement Management and Administrative Statistics (LEMAS) but stopped tracking that data after a review found “fatal flaws” in LEMAS survey data and concluded that it was not “a valid and reliable basis for comparative statistical reporting and research purposes.” Another source of data from BJS is the Police-Public Contact Survey (PPCS)—a module within the National Crime Victimization Survey that collects data on respondents’ interactions with law enforcement. Unfortunately, the PPCS has been vulnerable to sampling issues and the inherent limitations of its self-report survey methodology, such as the inability to measure fatal uses of force.
The deficiencies in official government statistics have motivated private data entrepreneurs to step in and fill the gaps. In 2013, the best known open-source database, Mapping Police Violence (MPV), started tracking uses of force based on keyword searches of media reports. Recently, MPV expanded beyond fatal encounters to track nonfatal incidents as well. However, relying on media accounts to farm data comes with certain downsides. For instance, some articles conflate the term “use of force” with other serious issues such as police misconduct.
In the pursuit of transparency, open-data projects can sometimes go too far, publishing the names of individual officers from Freedom of Information Act (FOIA) requests, even after they are exonerated. Others are overtly ideological, applying questionable methodology to “fix” things like missing data fields. While open-source data projects routinely find that a disproportionate number of racial minorities have been killed by police, this does not take into account demographic differences in violent crime rates. Without this context, open-source data alone can unintentionally lead to confusion, faulty interpretations, and a general misunderstanding of the nature and extent of the problem.
Sidebar: Data Collection Historical Snapshot
FBI National Use-of-Force Data Collection
In 2015, responding to recommendations in the President’s Task Force on 21st Century Policing, the FBI launched the most ambitious national data program to date: the National Use-of-Force Data Collection program. The program asks law enforcement agencies to voluntarily report on use-of-force incidents that result in the death of a person, serious bodily injury to a person, or the discharge of a firearm at or in the direction of a person.
According to an interviewee from the FBI, the goal of this program is to “provide an aggregate view of the incidents reported and the officers, subjects, and circumstances surrounding the incidents for use in identifying trends and characteristics.” The FBI started collecting data in 2019, releasing initial results after receiving responses from 40 percent of the nation’s 900,000 sworn law enforcement officers. The organization then released more data in 2022 after reaching 60 percent officer participation. As of February 2024, about 57 percent of the 18,514 federal, state, local, and tribal law enforcement agencies across the nation participated, representing 68 percent of the total officer population. Additional data will be released when the FBI reaches 80 percent officer participation.
Table 1 ranks states by their level of participation in the FBI Use-of-Force Data Collection Program. States are ranked by the percentage of officers in the state working at agencies that submitted data to the FBI (which the FBI rounds to the nearest percent). The proportion of agencies in the state participating is also listed.
Table 1: FBI Use-of-Force Data Collection Participation by State
The system is designed to make data submission as easy as possible, relying on information already collected during a standard incident investigation. One of the advantages of the FBI system is that it provides a systematic format for any agency—regardless of size or budget—to collect, collate, and analyze their own data on a local level. Eight states (Arizona, Florida, Illinois, Minnesota, Missouri, Nevada, Oregon, and Wisconsin) have mandated that law enforcement agencies participate, and, overall, agency participation has improved considerably over the past several years, increasing from 35.5 percent in 2019 to 54.8 percent in 2023 (Figure 3). In the current datasets, incidents of serious force remain uncommon: Each month since January 2020, less than 1.5 percent of all participating agencies in the United States have reported one or more serious use-of-force incidents (Figure 4).
Figure 3: Participation Trends in the FBI’s National Use-of-Force Data Collection (January 2020 – June 2023)
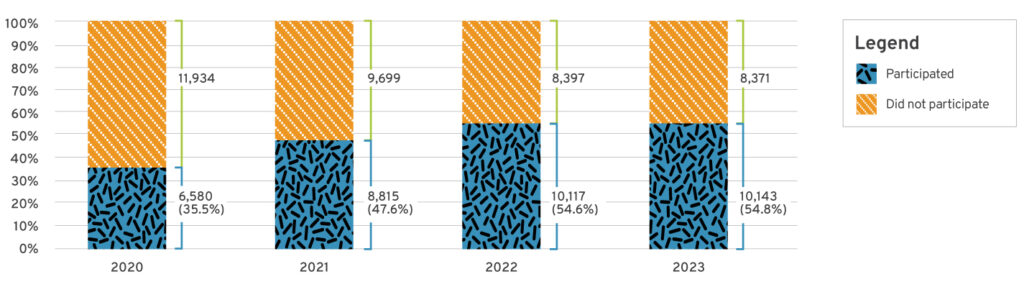
Source: “National Use-of-Force Data Collection: National 2023,” Federal Bureau of Investigation, 2023.
https://cde.ucr.cjis.gov/LATEST/webapp/#/pages/le/uof.
Figure 4: FBI’s National Use-of-Force Data—No Response vs. Zero Incidents vs. At Least One Incident (January 2020 – June 2023)
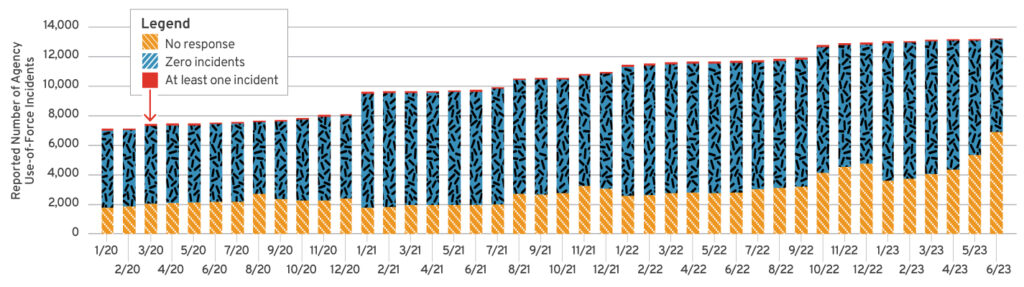
Source: “National Use-of-Force Data Collection: National 2023,” Federal Bureau of Investigation, 2023.
https://cde.ucr.cjis.gov/LATEST/webapp/#/pages/le/uof.
Although the FBI requires agencies to have a registered use-of-force data account on the Law Enforcement Enterprise Portal to be considered as “enrolled” and eligible to submit data, they also allow some agencies to participate and submit whatever data they have available. They broadly define “participating agencies” as those that are enrolled and/or have submitted data, including zero-incident reports. Like the FBI’s most prominent data product, the Uniform Crime Reporting Program, participation in the National Use-of-Force Data collection is strictly voluntary; the federal government cannot mandate participation because of the “anti-commandeering doctrine,” which has limited the government’s ability to impose affirmative obligations on state or local governments (including police agencies) since 1842. Thus, with few exceptions, such as consent decrees, local agencies cannot be required to adopt any particular approach to regulating police use of force. This means that agencies are allowed to miss reporting deadlines, which has required the FBI to categorize them as “no response” participating agencies. Monthly data from the beginning of 2020 demonstrates wide variation in non-response among participating agencies, ranging from as low as 18.5 percent to as high as 52.2 percent.
Policy Landscape
As the national use-of-force data program gains momentum, state lawmakers have been expanding local initiatives as well. Since Vermont passed the first use-of-force law in 1787, almost every other state has followed suit with legislation regulating police use of force and occasionally protecting officers from civil or criminal liability for doing so. Today, 42 states have use-of-force statutes on the books; 36 govern the use of both deadly and non-deadly force, and six apply to deadly force only. The remaining eight states lack statutes governing police use of force, leaving it up to the judiciary to regulate via case law. Many states have also created their own police use-of-force databases.
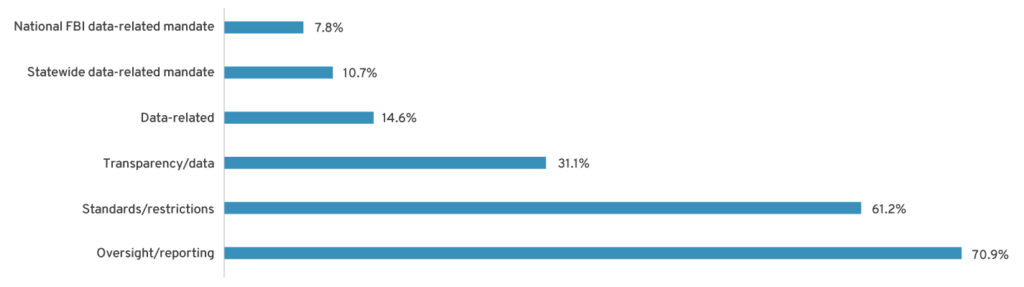
To supplement existing information on police transparency laws, which have not been updated in some time, we conducted an independent analysis of policing bills enacted after May 2020. We searched statutes for mentions of “force,” “use of force,” “excessive force,” “deadly force,” and other explicit use-of-force signals such as references to chokeholds, neck restraints, and other tactics. Based on these criteria, we found that between May 2020 and April 2023, 103 bills in 34 states and Washington, D.C. either created a new statute or revised an existing statute related to use of force. We further examined the content of these bills to identify whether they included one or more of the following themes: “oversight/reporting,” “standards/restrictions,” “transparency,” “data,” “statewide data mandate,” and “national FBI data mandate” (Figure 5). We observed that most legislation related to use of force in the last three years tended to include themes related to oversight/reporting (70.9 percent), followed by standards/restrictions (61.2 percent). A smaller percentage of these bills included topics specifically related to transparency (31.1 percent) and data collection (14.4 percent). The data focus grew smaller when we sought mentions of a statewide data mandate (10.7 percent) or participation in the FBI data collection program (7.8 percent).
Figure 5: Major Themes Highlighted in 103 Use-of-Force–Related State Bill Enactments (May 2020 – April 2023)
Thirty-one states now have a use-of-force statute on the books specifically dedicated to police transparency, most of which have been passed since George Floyd was killed in May 2020. Ten states have “complete” data policies that require state law enforcement agencies to collect information on all incidents in which officers use force against civilians and to report that data to the state— which must then publicly release statewide and agency-specific data (Figure 6). Other jurisdictions have “partial” data laws, either requiring collection without public release or requiring agencies to collect data only on a subset of force incidents, such as instances of deadly force. More information on these classifications can be found in Appendix A. As Figure 6 shows:
- Ten states include the trifecta of oversight, reporting, and transparency/data topics, as well as a statewide data mandate. These use-of-force data statutes are classified as “complete.”
- Twenty-one jurisdictions have use-of-force laws that include related oversight, reporting, and transparency/data topics, but without a statewide data mandate. These statutes are classified as “partial.”
- Nineteen states have use-of-force regulations with no provisions for data collection or transparency. These states are classified as “none.”
Made with Visme Infographic Maker
Limitations of FBI and State Data Systems
Just as the circumstances surrounding use-of-force incidents are often confusing and messy, tracking and collecting use-of-force data can also be challenging. Despite FBI data collection and new state laws, researchers still face substantial obstacles to collecting reliable use-of-force data, including variations in definitions, reluctance by police agencies to cooperate, and disagreement on the degree of detail needed on individual incidents. These problems cause many state-level use-of-force data collection programs to underreport force. For example, over a 10-year period, agencies in Texas failed to report hundreds of fatal encounters. In addition, suspiciously low figures are not uncommon, such as a large agency that officially reports fewer than 10 taser discharges or only a few K9 incidents. Using public records requests, Mapping Police Violence recently obtained data covering more than 300,000 incidents annually and discovered significant underreporting and disparities in how force is tracked and reported across different jurisdictions.
One way to improve data collection would be setting standard definitions and reporting policies, yet there is still a surprising lack of consensus on what constitutes a reportable use of force. In the absence of a standard definition, most agencies require the reporting of any encounter that involves coercive contact between an officer and a suspect. This can include anything from putting handcuffs on a suspect to subduing someone with a taser. Some departments even track verbal threats of force. The police department in Arlington, Texas, for example, has adopted a broad reporting policy requiring officers to submit a report after pointing (or, in some cases, even drawing) a firearm. Interestingly, most of the agencies we interviewed agreed that pointing a weapon at a suspect should be considered a use of force, but not all did. Jacksonville, Florida, for instance, uses a more narrow definition and requires that strikes be reported but not holds or takedowns. A meta analysis of 36 different use-of-force studies found agencies have wildly different understandings of what does and does not constitute “force,” and a substantial lack of precision in how rates of force are measured and calculated.
The lack of consistency between agencies makes any meaningful analysis of the data or comparisons across jurisdictions difficult. In 2017, researchers surveyed the 50 largest police departments in the country about their force policies, expecting that larger agencies would be more likely to have a consistent set of detailed, evidence-based practices. Instead, they found a widely varied set of policies, many of which lacked clear guidance on verbal warnings, special mental health protocols, or even whether officers must use the minimum amount of force necessary. According to the report, about half of the policies did not discuss common de-escalation techniques that can be used to defuse a violent situation. A 2011 study was even more critical of the unscientific approach to use-of-force policies, stating that many “departments pick and choose, and tweak and adapt in a multitude of ways—all unfortunately, with no empirical evidence as to which approach is best or even better than another.” In short, most use-of-force policies are developed with little, if any, empirical foundation, because such data does not exist.
One obvious problem with the FBI data collection project and many state databases is that limiting data collection to incidents that result in death, serious injuries, or gunshots leaves out most uses of force. In Texas, for example, a state law requires that police agencies report on “officer-involved injury or death,” but then narrows the definition “to incident[s] during which a peace officer discharges a firearm causing injury or death to another,” ignoring the thousands of cases per year of nonfatal force. Some jurisdictions track only force involving weapons, collecting nearly no information about low- level force. This is a problem because there is only so much we can learn from serious uses of force alone. The aim of a professional police agency should be to minimize all uses of force, not just those that result in someone dying, going to the hospital, or getting shot. Ideally, police should aspire to resolve conflicts without having to resort to force at all. Collecting data on all uses of force, including low-level force, would provide police trainers and researchers with a better picture of the circumstances under which police apply different types of force and the proximate causes of escalation that result in serious injury or death (see Appendix B for a list of types of use-of-force data that would ideally be collected). In his work advising law enforcement agencies on data collection, one of our interviewees advocates for a broad definition of force for reporting purposes, explaining that “you want as much reported as possible. Having more data will allow the agency and the public to evaluate the efficacy of the delivery of public safety.”
Of the many data elements collected by the FBI (see Appendix C), only a few have been released to the public. The CEO of a Washington-based private data firm thinks this is a mistake, noting the irony of holding back data in a program intended to improve transparency. This expert went so far as submitting an FOIA request for the FBI data, arguing that the data they are keeping under lock and key is for the public’s use and not for criminal investigations. Although his request was initially denied, that denial was overturned on appeal. However, the FBI then estimated that his request would take 67 months (more than 5 years) to fulfill, effectively denying him a second time. “The FBI already has great crime data in NIBERS, so there’s no reason they can’t release use-of-force stuff. It’s political. The DOJ doesn’t want anyone to know what is going on with use of force,” he said. The FBI refuses to make the raw data publicly available because of an internal rule that prohibits the release of any agency-level information or other disaggregated data.58 Another of our interviewees agreed with the criticism, noting that the FBI program does more harm than good:
The locus of power in policing is at the local level, so if you don’t provide data at that level, you can’t analyze disparities or compare agencies against each other. The whole point was accountability and transparency, but the political incentives have corrupted the program. The government uses it to obscure, rather than shine a light.
Logan Seacrest interview with Sam Sinyangwe (Zoom), Jan. 31, 2024.
Figure 7: Types of Force Reported by the FBI’s National Use-of-Force Data Collection (2023)
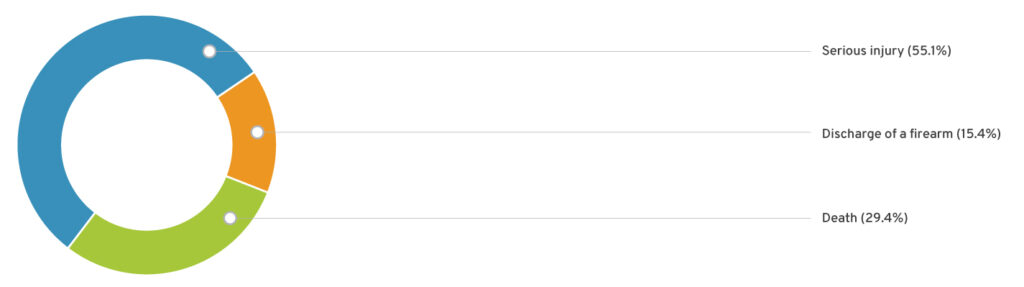
Source: “National Use-of-Force Data Collection: National 2023,” Federal Bureau of Investigation, 2023.
https://cde.ucr.cjis.gov/LATEST/webapp/#/pages/le/uof.
The last major piece of data that is often missing is the outcome of the use- of-force incident. A major drawback of the FBI and state data systems is their failure to provide insights into how often or to what extent officers use excessive force, whether that use of force aligned with policy, and the result of internal investigations. While these are perhaps the most salient pieces of information for researchers and the public, there has been no national effort to collect them. From a data standpoint, having that information would enable us to answer questions we cannot answer today.
Use-of-Force Data Wish List
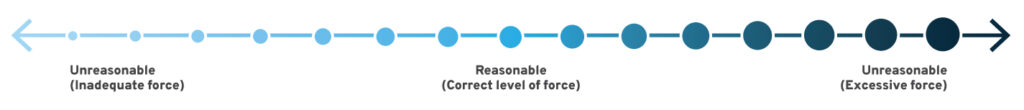
During fast-moving, dynamic use-of-force situations, officers are seldom able to consult a supervisor or field manual about what to do. Instead, they must apply their training and experience to make split-second decisions in chaotic and frightening situations. A momentary lapse in judgment can have catastrophic consequences. According to the officers in charge of Newcastle Delaware’s Use of Force Review Unit, never using force is not necessarily the optimal outcome, especially in a dangerous situation. “Whether it’s communication, persuasion, or coercion, the end goal is always as peaceful a resolution as possible. From time to time, an appropriate level of force can be a de-escalation tool to get there,” they said.61 Thus, an ideal data system will roughly pinpoint where an officer’s actions fall on the spectrum between too little force and too much force (Figure 8). This determination requires knowing many details about both the situation and the parties involved.
Figure 8: Simplified Spectrum of Reasonableness
Determining the data that should be collected for an ideal use-of-force data system requires reviewing relevant case law on what legally constitutes excessive force. In Graham v. Connor, the Supreme Court held that under the Fourth Amendment, the ultimate question in use-of-force cases is whether the officer’s actions were “objectively reasonable” under the circumstances and considering the information available to the officer at the time. According to the Graham decision, such an analysis entails “a careful balancing of the nature and quality of the intrusion on the individual’s … interests against the countervailing governmental interests at stake,” which requires “careful attention to the facts and circumstances of each particular case.”
- First, the severity of the crime at issue must be considered.
- Second, the immediate threat to officers and others posed by the subject must be evaluated.
- Third, whether the subject is actively resisting or attempting to evade arrest by fleeing must be taken into account.
The Court also recognized the importance of the proportionality of the force used and the totality of circumstances. Taken together, these “Graham factors” are vital components of any system that is intended to provide actionable insights from use-of-force data.
Consider, for example, a teenager caught stealing Pokémon cards from a comic bookstore. While there is a governmental interest in stopping shoplifters, a petty theft is not the type of crime that would lead a reasonable officer to believe that the suspect is dangerous enough to warrant deadly force. However, if the thief screams “I gotta catch them all!” and threatens the officer with a knife, the governmental interest in protecting public safety suddenly calls for a significantly higher level of force. Now, suppose the officer gives chase, and the Pokémon fan trips, falling into an open manhole. The calculus has changed again. The teen might still have the capability and intent to cause harm, but because he is stuck at the bottom of a sewer, he now lacks the opportunity to do so. According to the Graham factors, the fact that someone is capable of causing harm, has the opportunity to cause harm, or has the intent to cause harm does not justify using force: All three factors must be present.
Without knowing the detail about the manhole, basic information about the individual and their level of resistance (such as the presence of a knife) would be insufficient to determine whether a given use of force was excessive. In other words, limiting a data system to surface-level factors will produce surface-level results. Most academic literature, as well as the FBI database, tends to focus on demographics and fails to consider other relevant causal factors. The founder of the Association of Force Investigators, a university professor who spent 10 years as a police officer, compares this approach to tallying up all deaths in a hospital to figure out how to improve health care. Simply aggregating every use of force that results in an injury is not useful because every case is different.
Most of the time, using force is not something that happens spontaneously as the result of a single decision. Instead, it is an iterative sequence of actions and reactions—each increasing or decreasing the likelihood that force will become necessary. Fully evaluating an incident requires assessing what happened in the seconds, minutes, and even hours before the officer pulled the trigger. According to the experts we interviewed, data systems tend to focus on the moment, or perhaps the few seconds, in which an officer uses force.66 Narrowing the time period simplifies the task of data collection but artificially limits the scope of inquiry, which risks leaving out relevant facts and circumstances. As such, a data system must cover an adequate period to determine whether force was reasonable, including the decision points that preceded the initiation of violence by either the officer or the subject. Looking beyond the final frame of an encounter has implications for police training, agency culture, and officer performance in real-world situations.
On a quantitative level, a data system should allow an agency to compare its performance to itself or other agencies over time. One way to reduce use of force is to reduce overall arrests, but that is not necessarily helpful from a public safety perspective. For example, jurisdictions under a consent decree often see an associated reduction in arrests, which does successfully reduce low-level force. On the contrary, if a city is not policing as proactively, crime can increase over time, leading to more serious incidents of police violence. The goal should be to reduce use of force, not necessarily to arrest fewer criminals. One Washington-based private data firm provides agencies with indicators such as a ratio of force/arrest so they know whether a reduction in use of force is the result of decreased police activity. The firm also timestamps all incidents, so if officers are routinely resorting to force during the third or fourth call in overtime shifts, schedules can be adjusted accordingly.
Law enforcement leaders also need to know whether the use of force radically
varies between two or more geographies, divisions, or officers. One neighborhood might simply be more dangerous than another, which you would expect to lead to more use of force. However, if there is a wide discrepancy between two similar neighborhoods, something else may be going on. One of our interviewees explained:
If two districts have different rates of force per arrest, what is causing that? Is it varying in ways we expect, or ways we don’t expect? The core competency requires you to accurately determine a peer group for comparison or else officers in more dangerous areas will get unfairly flagged.
Logan Seacrest interview with Ben Horwitz (Zoom), Nov. 29, 2023.
Most of the private firms we interviewed provide agencies with geographic heat maps of locations in which police are using force most often. To understand whether officers in a particular district are using more or less force than they should, large agencies have started hiring in-house statisticians to standardize the data, controlling for differences between diverse sample populations.
Free Market Solutions
Use-of-Force Data Platforms
Law enforcement agencies are increasingly looking to private-sector experts to help automate workflows and collect more use-of-force data. The founder of one private data firm has decades of experience collecting, analyzing, and applying this type of data to drive meaningful reforms. Drawing from his 14-year tenure with the city of Seattle, including two years as the compliance coordinator for the Seattle Police Department Consent Decree, he understands the gaps, oversights, and limitations of existing data. To address these issues, his firm developed a customizable, interactive data-dashboard system that allows residents of Dallas, Spokane, San Jose, and other jurisdictions to access their local police use-of-force data at any time. The company reviews all use-of-force reports to standardize the data, accounting for differences in how agencies collect and track information. Unlike the FBI’s system, which has been criticized for its narrow focus and lack of actionable insights, the data company’s tools encompass over 150 standardized data variables that provide a nuanced view of use-of-force incidents. To illustrate how this data can help inform training, the founder shared how the analytics for one client indicated that officers were rarely using their tasers and were suffering a higher rate of injuries in resulting scuffles. The agency was then able to retrain officers to increase taser use with better results and a reduction in injuries for both officers and subjects.
Artificial Intelligence
Artificial intelligence (AI) is revolutionizing the types of data that can be collected and the ways in which that data can be analyzed and made actionable. In Alameda, California, for instance, police are using AI tools to evaluate officer performance, measure the impact of training, and improve interactions between officers and the public. One of these tools combines speech recognition with a proprietary large-language model—the same technology that powers ChatGPT—to analyze police body camera footage that usually languishes on a server unseen. The software can comb through the footage, index it, make it searchable, and even identify subtle details that elude human reviewers. Natural language processing flags critical events or unprofessional behavior for command staff to review. The focus on audio allows for a scalable, more objective assessment of police encounters, independent of visual cues that might introduce implicit bias or civil liberty concerns. Importantly, the software is also able to highlight positive interactions that typical body camera reviews miss, such as an encounter with a citizen that was successfully de-escalated, offering new opportunities to celebrate officers, disseminate examples of exemplary police work, and foster a culture of positivity and continuous improvement. In addition, offloading this type of work onto AI agents frees up officers for tasks that require a more human touch and provides richer insights to help supervisors better assess their team members’ performance and identify areas for improvement. In fact, the Alameda police department has reduced use-of-force incidents by 36 percent with training improvements that were informed by these tools.
Private Training Consultants
Law enforcement agencies are also turning to private consultants for advice on tactics, such as weapon handling. One of the most sobering facts about police shootings is that the most tragic outcomes are caused by tactics that have worked in other situations but, due to human fallibility and chaotic circumstances, create catastrophe. This was the case in the 2021 shooting of Daunte Wright, a young Black man who was pulled over for a traffic violation by Officer Kim Potter in Minnesota. After a brief struggle, Potter shot Wright in the chest once at close range. The officer said she had meant to use her taser, shouting “Taser! Taser! Taser!” before accidentally firing her service pistol.
The founder of one private training group that works with law enforcement agencies to improve systemic weapon handling issues said that simply drawing a weapon inherently limits an officer’s ability to use other force options and makes a deadly outcome more likely. “We’ve seen dozens of these incidents now,” he explained. “Here you have a tool that feels and operates exactly like a handgun right on the officer’s belt. People get tunnel vision in extreme circumstances and make mistakes.” This group also encourages a shift away from a culpability paradigm toward a systems model that better accounts for human fallibility. “Too often, we start by blaming the officer. The problem with that is, if we get rid of one individual officer, the immediate problem may go away temporarily, but that doesn’t improve the systemic issue,” the group’s founder said. Drawing parallels with aviation and medicine, he advocates for the implementation of checklists and redundant safety mechanisms to mitigate the impact of inevitable errors, rather than focusing solely on punitive measures after something bad occurs.
As a specific example of this approach, the group worked with the Miami- Dade police department to identify common mistakes officers make and design policies and tactics to anticipate and avert force before it becomes necessary. When their analysis revealed that officers were more likely to be injured approaching on the driver side of a vehicle during traffic stops, use-of-force experts reverse engineered stops to keep officers out of that danger zone for as long as possible. In addition, a decade ago, Miami was averaging between 500 and 600 use-of-force events annually. After implementing a data-driven approach to training, those numbers began to drop dramatically. Now, out of 1.8 million calls for service, 990,000 citizen contacts, and 24,000 arrests each year, Miami averages fewer than 200 uses of force. Miami-Dade’s former director of training said that a deep commitment to transparency and community engagement was critical to this success:
A lot of the damage that’s been done in recent years has been due to law enforcement’s lack of ability to explain why things happen. When you release a report once a year, does that get into the hands of the community? Probably not. You need to constantly engage to make a difference.
Logan Seacrest interview with Carlos Gonzalez (Zoom), Nov. 20, 2023.
Collaborating with local universities and community groups, the Miami-Dade police department has also worked to demystify law enforcement and engage in community outreach. In fact, their recently retired director is now applying lessons he learned on the job to a new private consulting company, developing force analysis methodology inspired by human performance research, military tactics, and sports.
Recommendations
A modern use-of-force data system must be able to determine whether an officer’s actions are appropriate for any given situation. However, few data systems can currently do this—in large part because of issues with data collection and state and federal policy. To overcome these barriers, we suggest that agencies and policymakers consider the key recommendations below.
Law Enforcement Agency Recommendations
- Gather data based on Graham factors (i.e., crime severity, threat to officers and others, subject actively resisting or evading arrest) to identify variables/metrics that are essential to determine “reasonableness.”
- Report all uses of coercive force beyond physical contact with a compliant subject. At a minimum, agencies should require officers to report uses of physical force that either do, or could, result in an injury.
- Agency policy should clearly identify reportable force events; that is, those that require the completion of a “use-of-force” or “response-to-resistance” form.
- Use drop-down options wherever possible in use-of-force reports instead of freeform text fields to ensure uniform classification, improve data quality, and facilitate meaningful analysis.
- Require that officers complete use-of-force reports before reviewing body camera video or conferring with other officers.
- Use-of-force incidents should be reported as quickly as possible because data integrity deteriorates quickly over time. Similarly, timelines between a use- of-force incident and departmental action should be as short as possible to protect data quality.
- Link uses of force directly to specific calls for service. Police reports and use-of- force reports are often separate; tying the two narratives together can provide additional insight.
- Use a simple Y/N/NA field as to whether any subsequent investigation found a particular incident to be in or out of policy, as defined by the agency’s own administrative standards. In other words, basic confirmation on whether the officer did what their commanders—as opposed to any other sources of authority—told the officer to do.
- Differentiate between the data collected for internal monitoring (confidential and granular) vs. data collected for external reporting (deidentified and high- level).
- Standardize data, such as calculating uses of force per arrest, to create benchmarks that are comparable with peer agencies.
- Periodically spot check reporting fidelity against written guidelines to avoid “garbage in, garbage out” issues.
- Compare data on use of force with resistance to arrest reports to check for underreporting.
- Use automated tools to scan body camera footage for clear communication, sound tactics, and adherence to de-escalation protocols.
- Integrate use-of-force data with management or performance analytics to help supervisors identify training issues or monitor for early signs of a problem.
- Communicate early and often about the goals of a data collection program, as this increases the odds of stakeholder buy-in.
- Make real-time use-of-force dashboards available online.
State and Federal Policymaker Recommendations
- Standardize reporting, at least at the state level.
- Consider creating a national template for use-of-force data reporting (e.g., akin to electronic medical records) to facilitate comparisons across jurisdictions.
- Disaggregate FBI use-of-force data elements to make the program more useful for research purposes.
- Add an option to submit use-of-force data to the FBI within the Uniform Crime Report to increase participation.
- Require that agencies publish the actual text of use-of-force policies to enhance accountability and incentivize departments without an explicit policy to develop one.
- Mandate the release of financial information related to use-of-force judgments and settlements.
- Audit law enforcement data with open source information from county coroner offices, state collection programs, media reports, and private databases.
- Introduce incentives, such as federal funding for participation in the FBI data collection program.
- Establish standard metrics, such as a low use of force per arrest rate, to identify agencies with the best practices.
- Study the relationship between state policy, such as transparency laws, and use-of-force rates.
Conclusion
Although unjustified force is rightfully condemned by the public, politicians, media, and—in some cases—civil and criminal courts, comparatively little credit is afforded police when they resolve dangerous situations with minimal or no force whatsoever. When force is necessary, most officers use it judiciously, and abuses are rarer than media reports might imply. Yet too often, police sabotage themselves. Historically, neither policing as an industry nor most individual police agencies have been particularly enthusiastic about sharing use-of-force and similar information with academics or a broader audience. This lack of transparency undermines trust and contributes to the perception that officers are using force unnecessarily, too frequently, or in problematically disparate ways.
Law enforcement agencies must embrace transparency and find better ways to share more data in a timely manner. Police agencies that fail to do so appear to be hiding something, whereas agencies that release what they have, when they have it, are more likely to be perceived as legitimate. Like any information about government performance, this data ultimately belongs to the public. Just as shareholders in a company expect regular updates about business performance, the public deserves information about the quality of services they receive and what is being done to improve those services. Policymakers and police executives need to know how police are currently using force, how regulations shape behavior, and how training and culture influence officer decision making. Most importantly, use-of-force data is vital for citizens in a democracy, who have a right to understand how they are being policed.
About the Authors
Logan Seacrest is a resident fellow on the Criminal Justice and Civil Liberties team. He produces research and analysis on the criminal justice system with a focus on juvenile justice.
Jillian E. Snider is the policy director for R Street’s Criminal Justice and Civil Liberties team and a former New York City police officer. She produces research and commentary on public policy related to all stages of the criminal justice system: policing, pretrial policy, sentencing, incarceration, juvenile justice, and reentry.
Contributors
We would like to thank Sumita Das for her contributions to the research and data analysis for this study.
Appendix A: Categories Used to Classify Use-of-Force Data Legislation for this Study
| Use-Of-force topic of interest | description |
|---|---|
| No New Use-of-Force Legislation | States that did not enact any new use-of-force–related policing state legislation since May 2020; this does not cover use-of-force policies that may have existed before May 2020. The following 16 states did not have any new or revised use-of-force–related bill enactment between May 2020 to April 2023: Alabama, Alaska, Georgia, Idaho, Kansas, Michigan, Mississippi, Montana, Nebraska, New Jersey, North Dakota, Ohio, Rhode Island, Tennessee, West Virginia, and Wyoming. |
| Other Use-of-Force Topics | States that enacted some use-of-force–related legislation other than on topics related to oversight, reporting, transparency, and data. Examples include use-of-force–related topics focused on standards/restrictions, employment, decertification/certification, and training. The following six states covered use-of-force topics outside of the use of force trifecta of oversight, reporting, and data/transparency: Indiana, Iowa, Louisiana, Pennsylvania, South Carolina, and South Dakota. |
| Oversight, Reporting Without Transparency / Data Topics | States that enacted at least one piece of use-of-force–related legislation on the topic of oversight and reporting of use of force, without any mention of transparency or data in use- of-force reporting. The following 10 states covered use-of-force topics of oversight and reporting without mentions of data/transparency: Arkansas, Connecticut, Hawaii, Kentucky, Massachusetts, New Hampshire, New Mexico, New York, Oklahoma, and Texas. |
| Oversight, Reporting with Transparency / Data Topics | States that enacted at least one piece of use-of-force–related legislation on the topic of oversight and reporting of use of force that also mentioned transparency or data in use-of- force reporting. The following 10 jurisdictions covered the use-of-force topic trifecta of reporting, oversight, and data/transparency: Delaware, District of Columbia, Florida, Maine, Minnesota, Oregon, Utah, Vermont, Virginia, and Washington. These jurisdictions did not include additional language around statewide data-reporting mandates. |
| Oversight, Reporting, Transparency with Data Topics, Including a Statewide Data Mandate | States that enacted at least one piece of use-of-force–related legislation on the topic of oversight and reporting of use of force, that also include mentions of transparency or data in use-of-force reporting. The legislation from these states also contain direct or explicit mentions of a statewide directive to report use-of-force data or guide all law enforcement agencies in the state to report data to a central, state-level body. The following nine states mentioned oversight, reporting, transparency/data in their use- of-force legislation and also included language around statewide data-reporting mandates: Arizona, California, Colorado, Illinois, Maryland, Missouri, Nevada, North Carolina, and Wisconsin. |
Appendix B: Recommended List of Data Elements that Law Enforcement Agencies Should Consider Incorporating into Use-of-Force Data Systems
Subject Characteristics
- Age, gender, race, height, and weight
- Physical condition (e.g., level of fitness, strength, speed, exhaustion)
- Apparent psychological condition, including mental-health conditions and the influence of alcohol or drugs
- Apparent knowledge or training in self-defense
- Conduct, including verbal statements and specific movements (body language) and their level of compliance or noncompliance at that point in the interaction
- Resistance level, including specific actions
- Weapons held by or immediately accessible to the subject
- Apparent intent in using or immediately obtaining weapons
- Criminal history (e.g., weapon possession, violent resistance, flight)
Officer Characteristics
- Number of officers on the scene able to physically interact with the subject and their positioning
- Age, gender, race, height, and weight
- Physical condition (e.g., level of fitness, strength, speed, exhaustion)
- Training in combative or defensive tactics
- Weapons held by or immediately accessible to the officer
- Force options and physical techniques available to the officer at the time
- Law enforcement experience (in service years)
- Education level
- Officer precinct or jurisdiction
- Time on duty
- Military service
Encounter Characteristics
- The nature of the interaction, including the severity of the suspected offense, if any
- The physical proximity of the subject to officers and bystanders
- The degree to which the subject’s movement has been limited even when the subject has not been restrained (e.g., whether the subject is seated, surrounded by officers)
- The extent to which the subject has been effectively restrained and the extent of their ability to resist or flee despite being restrained
- The use of vehicles (e.g., PIT maneuver), if any
Environmental Factors
- The nature of the immediate area, including the presence and reaction of bystanders, if any
- Environmental factors that could affect officer or subject sensory perceptions, including lighting, background noise, etc.
- Weapons potentially available to the subject and officers, including weapons of opportunity (e.g., a rock laying on the ground) and weapons worn by the officers themselves
- The availability of obstacles that affect the suspect’s or officer’s ability to move freely or close the distance
- The availability of cover and concealment
- Any environmental options that would enable or restrict the subject’s resistance or the officer’s use of force
Appendix C: Key Data Elements Collected by the FBI in Their National Use-of-Force Data Collection Program
Incident Information
- Total number of officers who applied force
- Location and location type (e.g., street, business, home)
- Did the officer approach the subject?
- Was it an ambush incident?
- Was a supervisor or senior officer consulted during the incident?
- Reason for initial contact (e.g., routine patrol, traffic stop)
- If the contact was due to unlawful activity, what was the most serious offense the individual was suspected of?
- If applicable, the National Incident-Based Reporting System record or local incident number of the report detailing criminal incident information
Subject Information
- Age, sex, race, ethnicity, height, and weight
- Injury/death of subject
- Type of force used
- Did the subject threaten the officer or another person?
- Did the subject resist?
- Was the subject believed to have a weapon?
- Types of resistance or weapon involved (e.g., threats, physical aggression, firearms)
- Was the subject impaired? (e.g., mental health, drugs, alcohol)
Officer Information
- Age, sex, race, ethnicity, height, and weight
- Years of service in law enforcement
- Was the officer a full-time employee?
- Was the officer on duty?
- Did the officer discharge a firearm?
- Was the officer injured? If so, what was the officer’s injury type?
Meet the team
R Street’s Criminal Justice and Civil Liberties Policy program works across the ideological spectrum on public policy impacting almost every stage of the criminal justice system: incarceration, juvenile justice, policing, pretrial, bail reform, reentry and sentencing. Our reforms are grounded in ensuring public safety, due process, fiscal responsibility and individual liberty.