Trump’s Proposed $5,000 Child Tax Credit: Analyzing Various Approaches
President Donald J. Trump’s proposal for a $5,000 Child Tax Credit (CTC) has sparked interest, though details remain scarce and largely undiscussed. This post delves into possible ways this campaign pledge could take shape, focusing on critical design choices regarding how benefits might phase in and out. These decisions will be pivotal in shaping the CTC’s impact on household income, poverty reduction, and work incentives, as well as its overall cost to taxpayers. Exploring various implementation scenarios, this analysis will shed light on the potential trade-offs and outcomes of this significant policy proposal.
Proposals and analysis in this post are based on Stata and the National Bureau of Economic Research’s TAXSIM—two statistical software programs used to simulate various hypothetical CTC policy changes and explore their potential impact on U.S. households. Most data in this analysis comes from R Street calculations based on IPUMS Current Population Survey (CPS) data, thereby ensuring projections are grounded in robust, empirical evidence.
One key decision in implementing the proposed CTC is determining how benefits will be distributed. Two primary approaches are available: phasing in benefits with earnings (similar to the Earned Income Tax Credit (EITC) and the current CTC) or making the full benefit universally available to all families. The latter approach mirrors the temporary 2021 CTC expansion as well as universal child-benefit programs in countries like Canada, Germany, and Hungary. If the administration opts to phase in benefits, the phase-in rate becomes a critical factor. For instance, 15 percent and 30 percent phase-in rates mean that $10,000 in eligible earnings would generate $1,500 and $3,000 in CTC benefits, respectively. Because each additional dollar of earned income brings with it a larger credit, steeper phase-in rates provide stronger work incentives for lower-income parents and channel more benefits to families in need—those whose children are most sensitive to changes in household income. Research consistently shows that additional resources for lower-income families have the greatest impact on child outcomes. However, while phasing in benefits faster increases the reach and generosity of the credit for lower-income families and increases the incentive to work, it also raises the program’s overall cost.
Another important detail is determining the earnings level at which benefits begin phasing in. The current CTC starts phasing in for earnings over $2,500; in contrast, the EITC begins phasing in with the first dollar of earnings. This distinction is critical for low-income families. Consider a CTC that phases in at 30 percent and a family that earns $15,000. If benefits begin phasing in after $2,500 in earnings, the family would be eligible for $3,750 in benefits. However, if benefits begin phasing in with the first dollar of earnings, they would be eligible for $4,500. This $750 difference, while insignificant to higher-income families, is crucial for low-income families—especially considering that 5.7 million children live in households earning below $15,000. The Trump administration could boost work incentives for the poorest families while increasing benefits for lower-income households by departing from the current approach and adopting a policy of phasing in CTC benefits with the first dollar of earnings.
It is also important to consider age eligibility. Currently, the CTC is only available to children up to age 16. Expanding the program to include 17- and 18-year-olds (in the same way the EITC allows) would provide valuable benefits to millions of families. There are 4.3 million 17-year-olds and 4.0 million 18-year-olds in the United States, totaling 8.3 million dependent children—of which 1.0 million live in poverty and would greatly benefit from the additional income. Research shows that tax credits for families with older teenagers help these children go on to finish high school, attend and graduate from college, and achieve higher earnings as young adults.
Another critical decision in designing the CTC is determining how benefits will phase out. Phasing benefits out at lower income levels would help target the CTC toward families in greater need while significantly reducing the program’s overall cost. For context, the current CTC—created in 2017 under the Tax Cuts and Jobs Act—begins to phase out at $400,000 for married parents, whereas the previous iteration began to phase out at a much lower $110,000. Under the higher phase-out amount, a family earning $280,000 would receive the full $5,000 per child; that same family would receive no benefits if the phase-out began at $200,000 or lower. Reducing the phase-out threshold to $200,000 could save taxpayers about $24 billion per year, representing a substantial savings without excluding a majority of families in need.
The proposed CTC could also follow the model of universal child benefits, where benefits neither phase in nor phase out. Universal benefits provide consistent support to all families regardless of income, making the program simpler to administer and ensuring its equitability and inclusivity. By supporting all families, such programs tend to garner widespread societal and voter support, creating a sense of shared investment in the well-being of children across all income levels. This approach positions the CTC as a universal right for children rather than a targeted benefit earned by parents, strengthening its political and social sustainability but rendering it more expensive and less effective at reducing childhood poverty on a per-dollar basis.
An important detail to consider is where children fall in the income distribution. Figure 1 shows the income distribution of the 69 million children aged 17 or younger in the United States, with over 7 million living in families earning less than $20,000 annually. Overall, 40 million children live in families with incomes below $100,000; 29 million children live in families with incomes above $100,000; 10 million children live in families with incomes above $200,000; and 2.5 million children live in families with income above $400,000. That there are millions of children living in families with very low incomes illustrates the importance of availing CTC benefits to the lowest-income families.
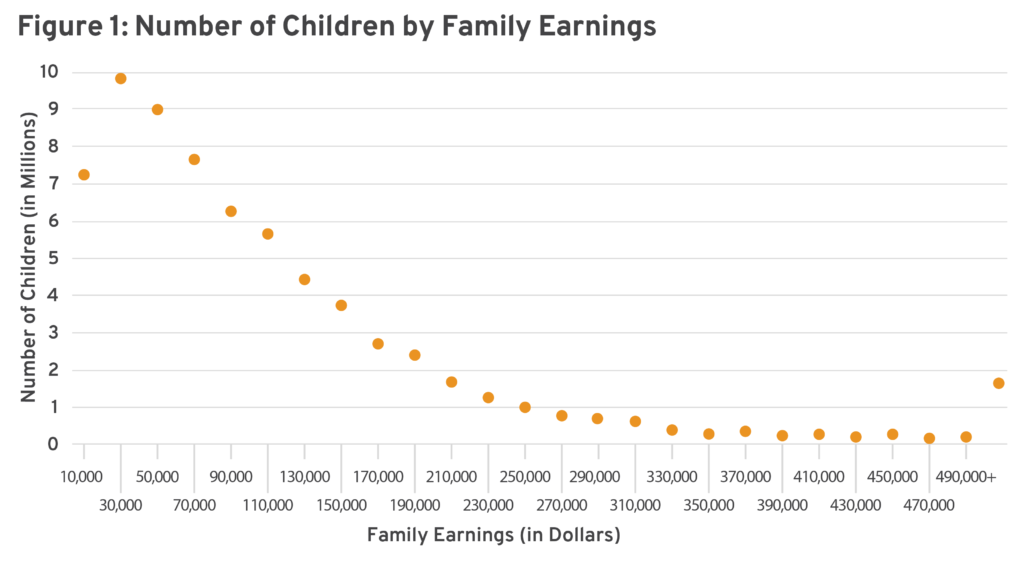
Figure 2 illustrates what various versions of a CTC could look like with maximum benefits of $5,000 per child. It shows four ways in which the CTC could phase in:
- Policy A – Benefits do not phase in, do not require earnings
- Policy B – Benefits phase in at 60 percent rate, start with first dollar of earnings
- Policy C – Benefits phase in at 30 percent rate, start at $2,500 in earnings
- Policy D – Benefits phase in at 15 percent rate, start at $2,500 in earnings
Figure 2 also shows four ways in which the policy could phase out:
- Policy W – Benefits do not phase out
- Policy X – Benefits phase out at $100,000
- Policy Y – Benefits phase out at $200,000
- Policy Z – Benefits phase out at $400,000
Altogether, these options create 16 combinations showing what the CTC could look like under the Trump administration. While these scenarios were chosen to provide a broad array of options, there are endless variations to be considered.
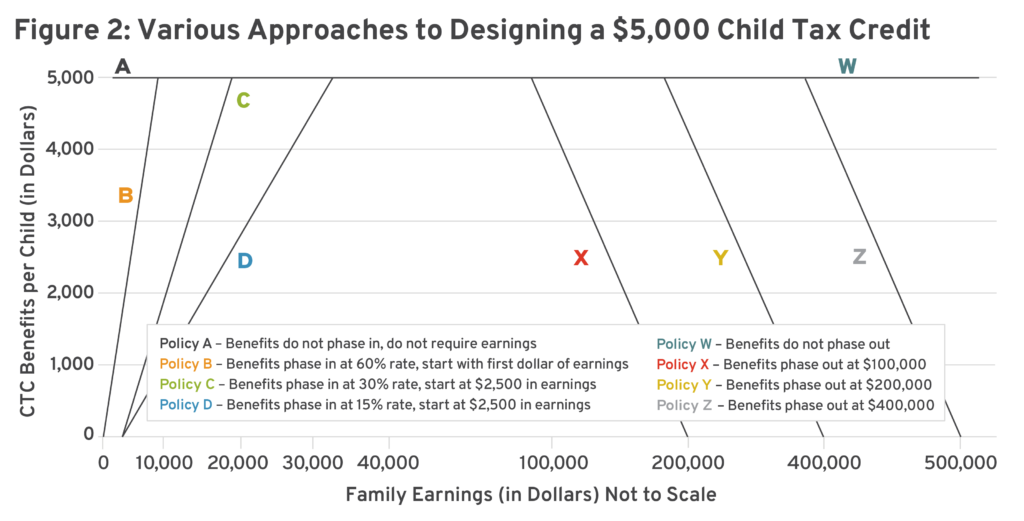
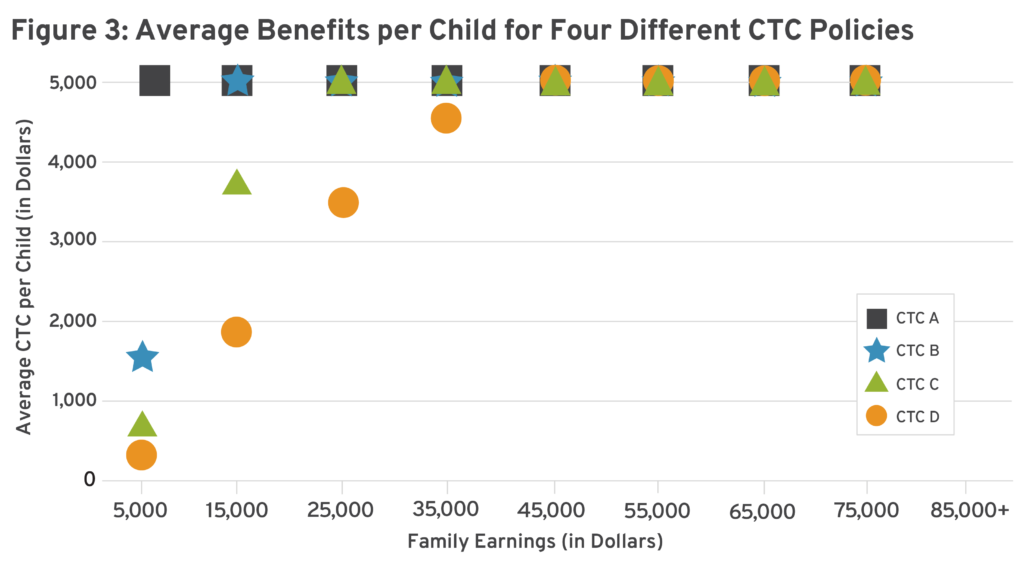
Figure 3 shows how different phase-in rates would impact per-child benefits by family income. For the poorest families with incomes below $10,000, Policy A would have the largest impact ($5,000 per child); Policy B the next largest (about $1,500); and Policies C and D the smallest ($500 and $200, respectively). For families with incomes between $10,000 and $20,000, Policies A and B would each provide $5,000 per child; Policy C $4,000; and Policy D $2,000. For families with incomes between $20,000 and $30,000, Policies A, B, and C would each provide $5,000 per child; Policy D would provide $3,500. For families with incomes between $30,000 and $40,000, Policy D would provide $4,700 per child (compared to $5,000 for Policies A, B, and C). Finally, for families with incomes above $40,000, each policy would provide the full $5,000 per child.
For families living in poverty or in deep poverty, the phase-in rate matters, but the phase-out rate does not. Based on the per-child benefits shown in Figure 3, Policy A should have the largest impact on poverty, followed by Policies B, C, and D. As a baseline comparison, the child poverty rate would be 15.2 percent without any CTC benefits. Child poverty would fall to 7.5 percent with Policy A (50.7 percent reduction), 9.1 percent with Policy B (40.1 percent reduction), 10.1 percent with Policy C (33.6 percent reduction), and 11.2 percent with Policy D (26.3 percent reduction).
The deep poverty rate among children would be 4.1 percent without any CTC benefits. Deep poverty would fall to 1.9 percent with Policy A (52.7 percent reduction), 3.0 percent with Policy B (27.8 percent reduction), 3.3 percent with Policy C (19.3 percent reduction), and 3.6 percent with Policy D (13.3 percent reduction). These numbers show the importance of providing benefits to the poorest families to best reduce child poverty.
Because they require earnings, Policies B, C, and D would provide the strongest work incentives. Each policy would lead to a net increase in working parents compared to the current CTC. Policy B would provide the strongest incentives, followed by Policy C and Policy D. Because it does not require earnings, Policy A would have no impact in this area. The only way Policy A could disincentivize work would be if it were to replace the current CTC, which phases in benefits with earnings. If Policy A were implemented without replacing another CTC policy, then the only disincentive would arise via the income effect channel. Canada implemented such a policy a decade ago with no negative effects on labor supply.
Finally, with regard to fiscal cost, phase-in and phase-out rates both matter quite a bit. Table 1 shows the net fiscal cost of each CTC policy, assuming all eligible families would receive benefits. These numbers represent the cost of different phase-in rates as well as different phase-out rates. The most expensive policy, A-W, would offer a universal $5,000 per child at a cost of $365 billion per year. The least expensive, Policy D-X, would phase in slower and out sooner at a cost of $238 billion per year.
Table 1: Net Fiscal Cost of Different CTC Policies
| Cost (in Billions) | Policy W | Policy X | Policy Y | Policy Z |
| Policy A | $365 | $303 | $345 | $359 |
| Policy B | $338 | $275 | $318 | $332 |
| Policy C | $324 | $261 | $304 | $318 |
| Policy D | $300 | $238 | $280 | $294 |
Next, we must determine which policy would be most cost-effective in reducing poverty. Using Policy X to lower the total program cost, Policy A would reduce child poverty by 50.7 percent—lifting about 5 million children out of poverty at an annual cost of $303 billion ($6.0 billion per 1 percent reduction). Policy B would cost $275 billion each year, reducing child poverty by 40.1 percent ($6.9 billion per 1 percent reduction). Policy C would cost $261 billion, reducing child poverty by 33.6 percent ($7.9 billion per 1 percent reduction). Lastly, Policy D would reduce child poverty by 26.3 percent at an annual cost of $238 billion ($9.0 billion per 1 percent reduction). The pattern is even starker for deep child poverty—each 1-percent reduction would cost $5.7 billion with Policy A, $9.9 billion with Policy B, $13.5 billion with Policy C, and $17.9 billion with Policy D. Because it provides full benefits to all low-income families, Policy A would be the most cost-efficient approach.
Conclusion
Design choices for Trump’s proposed $5,000 CTC carry profound implications for poverty reduction, work incentives, and fiscal responsibility. Among the options analyzed here, Policy A (universally available benefits) emerges as the most effective approach for reducing child poverty—particularly for families in the lowest income brackets. While this approach comes with a higher fiscal cost, its efficiency in addressing poverty makes it a compelling option for policymakers seeking to maximize social impact.
Conversely, policies with phased-in benefits tied to earnings (e.g., Policy B) offer stronger work incentives but achieve less dramatic reductions in poverty. Ultimately, the trade-offs between equity, efficiency, and cost underscore the importance of carefully calibrating both phase-in and phase-out rates to align the policy with broader economic and social objectives. If the administration navigates these decisions thoughtfully, the proposed CTC has significant potential to enhance the well-being of millions of families across the income spectrum.