Does the climate care who is president?
As President Joe Biden has exited his term, another opportunity is presented to see if the contrast in policy among presidents has a meaningful impact on greenhouse gas (GHG) emissions. When policymakers adopt new climate-related policies, they typically make claims as to the emission-cutting benefits of those policies. Similarly, when such policies are subject to reversal, critics may portend that those changes would bring about commensurate emission increases.
While individual policies can be measured and estimated, the broader question is whether climate policies in aggregate achieve their stated impact, as they become subject to many factors. Recent data permits us to examine these trends, though we are limited by the fact that we cannot easily attribute broader effects to specific policies favored by one president over another. For example, policies adopted under President Barack Obama’s administration likely had an effect during Trump’s former presidency, and similarly for Trump and President Biden. Nevertheless, overall observable trends can help us understand whether who is in the White House really has a big impact on GHG emissions.
Obama, Trump, and Biden on Total Emissions
With over a decade of U.S. carbon dioxide (CO2)-emission-related data, we can see how emissions under each president fared compared to projections prior to their term. For this, we compare Obama’s second term to Trump and Biden’s single terms via historical carbon dioxide emission data from the U.S. Energy Information Administration (EIA) and archived EIA projections. The following chart shows U.S. CO2 emissions from 2012 to 2024, with 2024 projected based on the latest EIA Short-Term Energy Outlook.
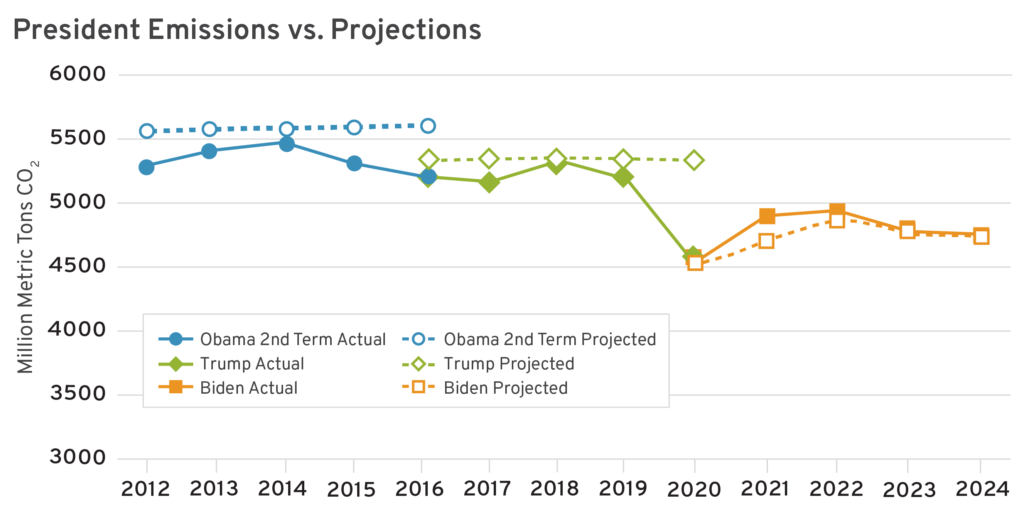
Let’s examine each president in turn. Emissions fell during Obama’s second term and were modestly lower by the end of his administration compared to 2012 projections.
Despite unwinding many climate-related regulations adopted under the Obama administration, Trump’s first term saw emissions that were in line with projections. Even before the COVID-19 pandemic, CO2 emissions were slightly lower than projected before Trump took office.
For the Biden administration, we primarily used projections from the 2021 Annual Energy Outlook (AEO), as the 2020 AEO was released in January 2020 and its projections quickly became irrelevant due to the pandemic. When looking only at total emissions, Biden’s are slightly higher than projected but still expected to have fallen compared to 2021.
Comparing Carbon Intensity
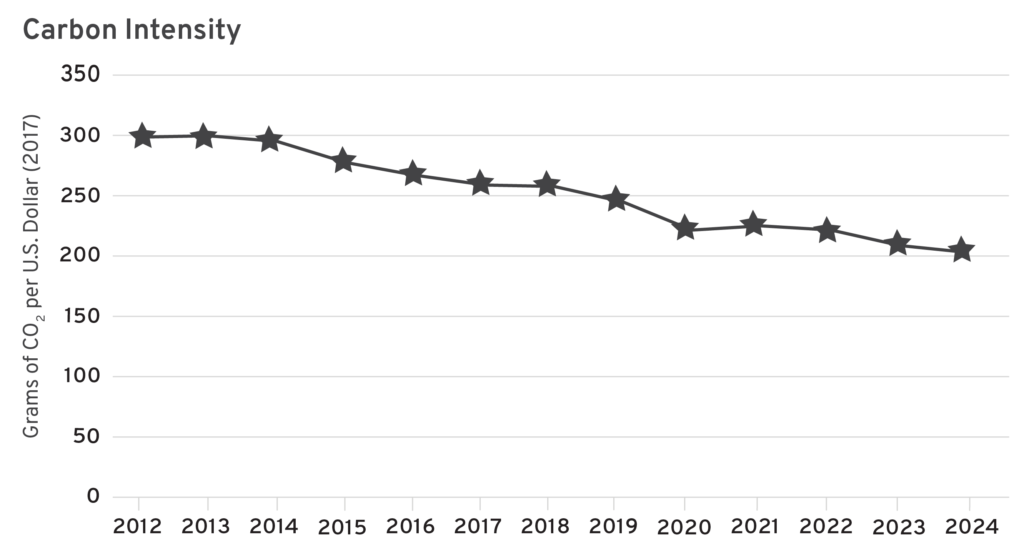
While total emissions can provide interesting data points as to the state of energy consumption in the United States, they do not offer much insight as to policy effectiveness because business cycle changes also affect emissions substantially. For example, a president can have an emission-cutting policy, but if economic growth overtakes that effect, it will seem as though emissions rose, when in reality emissions would be lower than the alternative scenario (and vice versa). For this reason, a more useful metric is “carbon intensity,” which helps control for business cycle effects by showing CO2 emissions relative to economic output.
For this analysis, we examined the projected economic output produced by the Congressional Budget Office (CBO) prior to the analyzed term as well as historical economic data from CBO. We then compared this data to emission data to produce a carbon intensity metric (EIA macroeconomic data was not used because CBO is the governmental body responsible for providing lawmakers with official macroeconomic projections). Overall, carbon intensity has improved steadily regardless of who was president or what major climate policies were promulgated (an exceptional event being the 2020 pandemic).
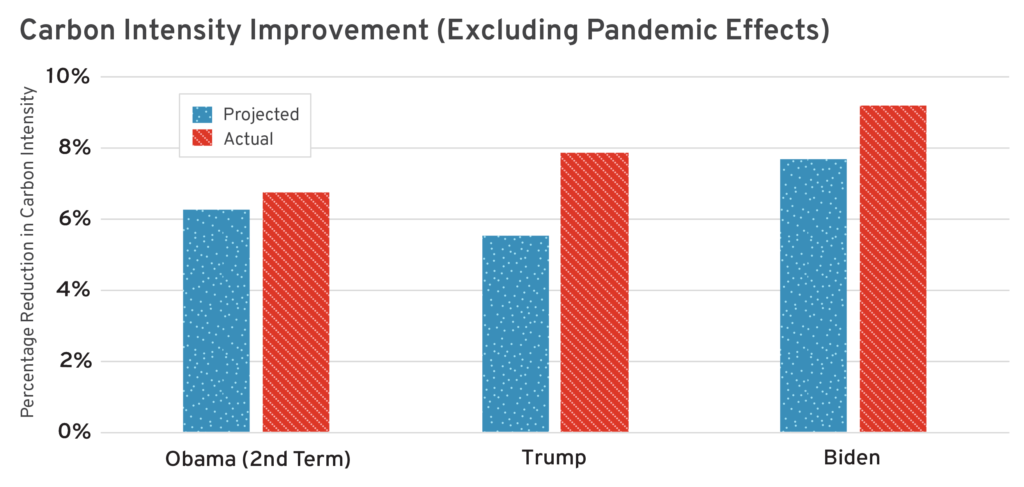
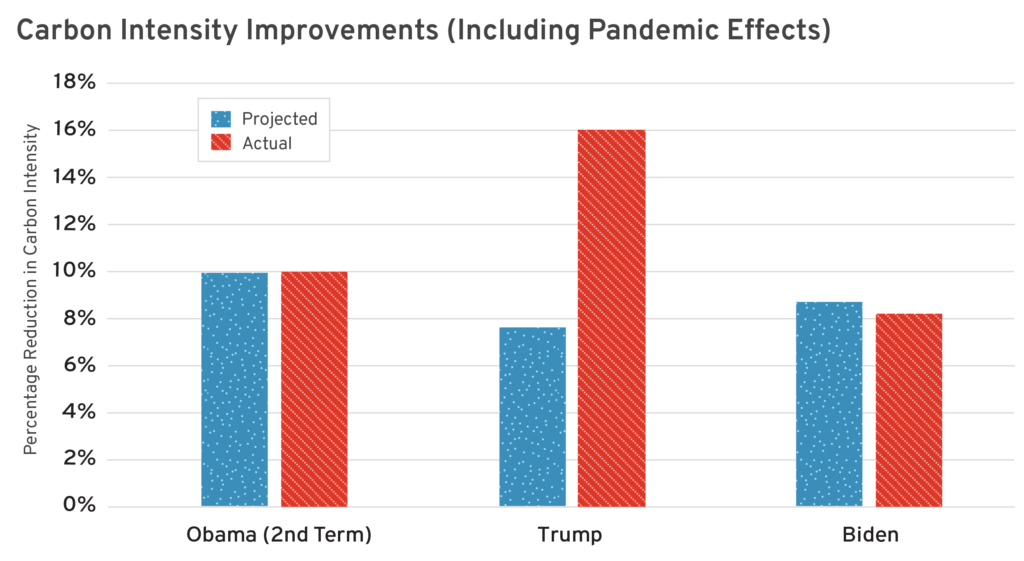
The following chart further breaks down the projected percentage of carbon intensity improvement under each president compared to the actual percentage of improvement. Pandemic effects are excluded from the first chart, and Obama’s term is truncated to three years in order to compare improvement within the same number of years under each president. The second chart includes pandemic effects—most significant for Trump because widespread remote work in 2020 significantly reduced the economy’s carbon intensity.
This data, coupled with total emissions, tells a more interesting story.
The first salient point is that despite Obama beating emission projections by a considerable margin, his carbon intensity improvement was not commensurate with that outcome. This is because economic growth under Obama was less than projected, so some of the emissions gap between his performance and projections is attributable to reduced economic output. This also indicates that his climate policies may have been less efficient than claimed (i.e., regulations may have cost more than estimated, leading to more drag on the economy).
The second salient point is that Trump had the opposite outcome to Obama. Trump just barely kept pace with projected emissions prior to the pandemic, but carbon intensity data shows that economic output relative to emissions improved faster than expected. Essentially, economic growth exceeded expectations during the Trump administration, and the improved efficiency meant that higher growth did not linearly increase emissions. This effect notably is present when excluding pandemic effects; however, when including them, we see that even though economic performance was weak in 2020, carbon intensity improved considerably due to behavioral changes like remote work.
Lastly, Biden has a more complex story. The EIA AEO projections for 2020 were released in January and did not account for the pandemic, making a comparison difficult. If one looks at projections from 2021, Biden modestly beat expected improvements to carbon intensity. However, when including 2020 data (this analysis used projections from the December 2020 Short-Term Energy Outlook), Biden underperformed. The discrepancy in the data is largely attributable to higher-than-expected emissions in 2021. If pandemic data is excluded, then Biden benefits from not being credited for emission increases in that year. Importantly, although Biden’s total emission output is higher than projected, economic output also exceeded projections over the same period.
The caveat is that policies implemented by one president but spanning into the succeeding administration can have an effect. Even though we can see how some presidents performed on climate, it is hard to gauge how much of that performance is attributable to their own policy actions.
When excluding pandemic-related effects, Biden had the largest carbon intensity improvement despite being the only president to have not come in below total CO2 emission projections. Trump can claim to have beaten projections by the largest margin. Obama, despite adopting aggressive climate policies, had a carbon intensity improvement largely in line with projections, indicating that poor economic performance is likely a significant explaining factor for falling CO2 emissions during his administration.
Policy Insight
Despite the considerable attention presidential climate policies have achieved in the media, whether they are promulgated or ended, the conclusion from the data is that they are not the primary determinant of the U.S. CO2 emission trajectory. Climate policy certainly matters, but there is a tension between a climate policy’s hoped-for effect and its broader economic outcome, as indicated by the overall consistent trend of similarly improved carbon intensity regardless of who sat in the Oval Office.
As an example of how climate policies may have less economy-wide impact despite their specific discrete impacts, renewable energy subsidies may shift investment into clean energy that should improve the economy’s carbon intensity. However, diminished investment elsewhere and higher deficits reduce net economic output, which can offset the apparent effect of the subsidy in making the economy cleaner. This may explain why Biden is expected to have higher emissions in 2024 than was projected when he took office, despite considerably larger renewable energy subsidies in 2024 than in 2021. Regulations may have a similar dynamic; inversely, more rapid economic growth can lead to an economy that is more energy efficient and with lower carbon intensity.
Despite all the attention climate policy receives, it typically only affects relatively minute aspects of the economy. Electric vehicle (EV) subsidies, for example, are constantly debated even though less than 1 percent of currently registered vehicles are EVs. Policymakers likely overstate the effects of their policy choices, as subsidies or mandates may only impact a small fraction of the economy’s energy consumption.
There is also the simple fact that the economy is the most important determinant of energy demand and, consequently, CO2 emissions resulting from energy consumption. While carbon intensity improvements lead to a reduced effect of economic growth on emissions, it does not eliminate the relationship. Events like the COVID-19 pandemic illustrate that the biggest changes in emissions come from events with broad, economy-wide impacts. Overall, the data indicates that broader economic conditions have a bigger impact on U.S. GHG emissions than individual climate policies.
Conclusion
Despite the attention garnered by climate policy, improvements to the economy’s carbon intensity is largely consistent across administrations. Policymakers seen as good on climate do not necessarily have a record that warrants such a reputation; likewise, policymakers seen as bad on climate likely do not have as large a negative effect as they are said to have.
Economic activity remains the most important determinant of total CO2 emissions from energy, and economic growth is typically accompanied by improved carbon intensity compared to scenarios of weaker economic growth. Policies with broader economy-wide effects are more likely to have significant impacts on overall emissions than discrete policies that specifically target select activities.