International emission data shows United States leading on climate and developing nations increasing emissions
Introduction
Global leaders recently convened to affirm their commitments to reducing global emissions. Part and parcel to this have been political narratives from various parties that are accusing one another of being insufficient in their climate action. This has been especially prominent as during President Donald Trump’s administration there was significant critique that the United States was going backward on climate policy. It is worth observing the data, though, to see if these perceptions are consistent with the truth. This analysis compiles publicly available data in several forms to illustrate how the United States compares to its developed nation peers—identified as those in the Organization for Economic Co-operation and Development, or OECD—as well as the first, third and fourth largest emitters—China, India and Russia.
Are we reducing emissions?
Historical Emissions vs Projected Emissions
While there is an almost constant pessimism surrounding the issue of global emissions, it is worth exploring a fundamental question: are we getting better at reducing emissions, or getting worse? To answer this question the best, it is worth revisiting older projections of global emissions. The Energy Information Administration’s (EIA) International Energy Outlook (IEO) recently had its 2021 update with projections of global energy use (updated every two years), and we can compare this to the 2011 edition to see the trend.
The figure below paints an interesting picture. Prior to the pandemic, global carbon dioxide (CO2) emissions in 2019 were 1.7 gigatons higher than expected, caused by the fact that developing nations’ emissions were 2.1 gigatons higher than anticipated and developed nations emissions were 0.4 gigatons lower than anticipated. Including the effects of the pandemic, 2020 global emissions were 0.9 gigatons below projections, driven mostly by developed nations that came in 1.8 gigatons lower than projected and developing nations coming in 0.9 gigatons above expectations. In terms of a split between developed and developing nations, the former has met or exceeded expectations of emission abatement, and the latter have performed far worse than expected.
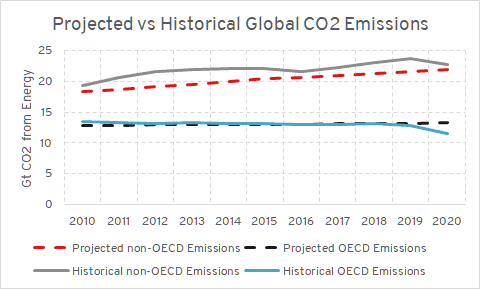
Sources: EIA 2021 IEO and 2011 IEO.
Some countries in particular stand out in this trend. The United States and Europe performed significantly better than expectations, coming in 1.22 and 0.55 gigatons below projections respectively for 2020, or 0.6 and 0.1 gigatons below projections if only observing to 2019. Other nations performed much worse, especially China. China’s emissions were 0.78 gigatons of CO2 above projections in 2020, and Russia and India were 0.25 and 0.08 gigatons above expectations, respectively. If only observing the data to 2019, China would be 1.1 gigatons above expected emissions, and Russia and India would be 0.3 and 0.4 gigatons above expected emissions, respectively. The graph below illustrates this.
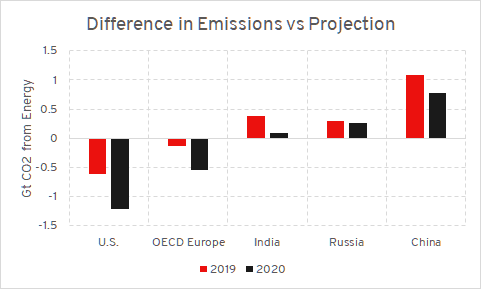
Sources: EIA 2021 IEO and 2011 IEO.
Additionally, some key regions performed much better than expected, and others much worse. The United States, Europe and developing nations in the Americas performed much better than expected by the 2011 projections. Meanwhile China, India, Russia and South Korea all performed worse than expected. Also of note, the 2016 IEO, which was produced shortly after the Paris Agreement, had unrealistically optimistic assumptions for China’s emissions, with its 2020 projection for Chinese emissions at a full gigaton below the 2021 estimate. Analytical expectations that China would respond to international adoption of a climate agreement seemed to have been incorrect, and the more pessimistic earlier IEOs were more accurate.
Total Emissions
In terms of total emission abatement, the recent IEO allows us to observe how emissions have changed since 2010. Generally, the emissions of developed nations have fallen, while developing nations have increased their emissions. Since 2010, the United States especially has reduced its emissions significantly, accounting for more than half of all emissions declines of developed nations. Meanwhile, major economies such as China, Russia and India have had steadily rising emissions, with China being the standout case and accounting for more than half of the emissions increase among developing nations over the 2010-2020 period.
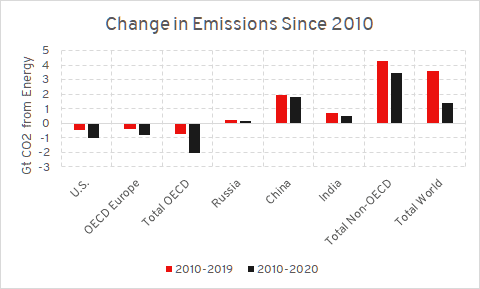
Sources: EIA 2021 IEO and 2011 IEO.
Emission Intensity
Total emissions, though, do not tell the whole story. Another measure of environmental progress is emissions intensity of energy utilization; the total amount of emission relative to the amount of energy consumed. In this category, the United States is a clear leader, and Europe and China have also made substantial improvements to their emissions intensity since 2010. Developing nations, though, have been lagging, and especially worrisome is that Russia and India have had barely any emissions intensity improvement since 2010, indicating that their environmental efficiency is stagnant, and they’ve made little to no improvement in addressing climate issues over the past decade.
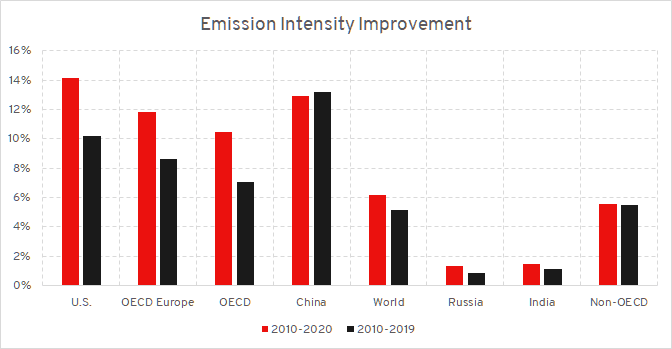
Sources: EIA 2021 IEO and 2011 IEO.
Total Global Fossil Use
Another important metric to gauge climate progress is the total consumption of fossil fuels globally. Over the 2010 to 2019 period, global fossil fuel consumption increased, despite substantial increases in the consumption of alternative energy sources. The effects of the pandemic did result in a marked decline in fossil fuel consumption, but this is unlikely to be representative of any sustained trend—particularly as fossil fuel prices have been rising.
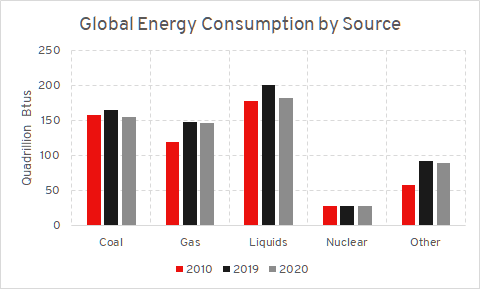
Sources: EIA 2021 IEO and 2011 IEO.
In 2019, fossil fuels represented 81 percent of global energy consumption, but the 2011 projection estimated that fossil fuels would account for 88 percent of energy consumption. This is of interest, because it means pessimistic projections of continued fossil fuel reliance appear to have been accurate, but at the same time fossil fuels make up less of a share of total energy consumption. The reason is that total energy consumption globally ended up higher than expected, and the salient takeaway is that either this increased energy demand was fulfilled by at least some fossil fuels, or alternative energy sources may not yet be substitutable with fossil fuels—transportation and industrial energy needs especially. Either way, growth of renewable energy resources appears to be a very poor metric of climate progress because the data does not indicate that an increase of renewable consumption resulted in any meaningful decrease in fossil fuel consumption.
The overall takeaway globally is that emissions are generally higher than expected, except for the pandemic year of 2020. The United States and other developed nations are reducing their emissions, but this progress is offset by higher than expected emissions from developing nations—especially China. Global fossil fuel usage is still high and expected to remain high. Widespread increase in the usage of alternative energy has not resulted in a decrease in fossil fuel usage. Even worse, Russia and India have had almost no improvement to the emission intensity of their energy consumption, indicating that if those nations had achieved similar improvements to efficiency as their peers, there could have been substantial emission abatement.
Is the United States leading?
There is a common argument posited in favor of big domestic decarbonization efforts that the United States needs to “lead” and that this will induce global reciprocity. The data, though, strongly indicates that the United States is already leading, and yet this has not resulted in global reciprocity.
The United States often measures its climate progress since 2005, its peak year for emissions. Of all the CO2 emissions reductions of OECD members since 2005, the United States is responsible for 67 percent. Essentially, the United States has reduced its emissions in recent years as much as all other developed nations combined. The United States is the second largest emitter, but the first, third and fourth largest emitters—China, India and Russia—all had increases, rather than decreases in their emissions. Since 2005, China has increased its emissions by 3.74 metric tons for each metric ton of emission decline in the United States.
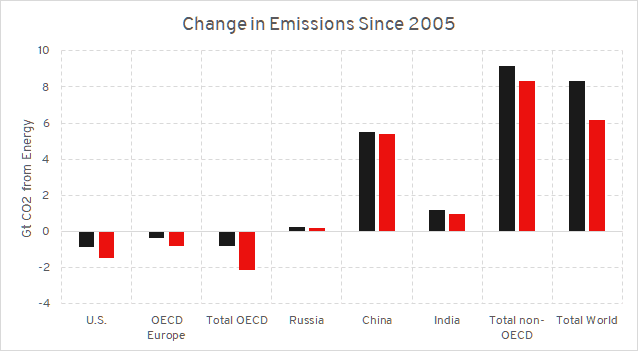
Sources: EIA 2021 IEO and 2011 IEO.
Furthermore, the United States has had a more rapid improvement in emissions intensity than other developed nations. Since 2005, U.S emissions intensity has declined by 18 percent, better even than developed nations in Europe (13 percent) and the OECD average (12 percent). This is also not simply a quirk of the pandemic since the trend is also present when looking at 2005-2019 data.

Sources: EIA 2021 IEO and 2011 IEO.
When looking at other major emitters, there is very little data to show that decarbonization in the United States was reciprocated globally. Even though U.S. emission declines since 2005 exceeded that of all developed nations combined, the United States is often criticized rather than applauded for its climate progress.
Additionally, the United States’ progress on emissions cuts is consistent with what would have occurred even if rules like the Clean Power Plan had stayed in place, or if the Waxman-Markey climate legislation from 2009 had passed, since the United States has beat both emission targets.
The overall international emissions strategy of the United States leading on emissions reduction and then the rest of the world being motivated to reciprocate was always more than anything an aspiration rather than a strategy, but the data paints a dismal picture to such an approach to international relations: the United States is leading on emission abatement, is in fact exceeding the emission abatement that would have occurred in alternative policy scenarios, and yet global emissions are still rising.
Conclusion
The data reveals several key insights. First, global emissions are rising, despite developed nations’ emissions falling. Developed nations have beaten emission expectations, and reduced emissions even more than was anticipated from 2011 projections, but much of this progress was offset by higher-than-expected emissions from developing nations.
Second, even though alternative energy usage is rising, this has not resulted in a commensurate decline of fossil fuel consumption. Policies that simply pursue the expansion of renewable energy are unlikely to in and of themselves result in a decline of fossil fuels, likely because the heterogeneous nature of energy demand scenarios mean alternative energy sources are imperfect substitutes. Internationally, policymakers should be pursuing avenues of reducing energy demand, improving efficiency, and improving the substitutability of clean energy resources relative to fossil fuel competitors.
Third, there are key emitters that are falling short of expected improvements in both their absolute emissions and progress on their total emissions relative to energy consumption. International agreements that could promote emission abatement or climate progress need only involve a handful of nations to capture the biggest opportunities for emission abatement.
And finally, the United States is far and away exceeding expectations for its emission abatement and is outstripping the combined progress of its biggest peers. Even in metrics of emissions relative to energy consumption, the United States is progressing more rapidly. Strategic narratives of the United States “leading” on climate and the rest of the world “following” seem unrealistic, because the data paints a very clear picture that the United States is already leading on climate progress, but other nations are not following.
As the Conference of the Parties (COP) has closed, it is worth noting that the prevailing narratives of climate action insufficiency on the part of the United States as a leading reason for rising global emissions does not seem to be reflected in the data. Policymakers seeking global reciprocity on emission abatement would be better served by identifying key opportunities from major emitters and engaging with those nations directly to capture identifiable abatement opportunities, rather than pinning hopes of climate progress on aspirations that may be inconsistent with the broader economically driven energy demand scenarios of peer nations.