Over a century, which years were inflation-control champions and which booby-prize winners?
How much can the rate of inflation move around? A lot.
The Consumer Price Index (CPI) began in 1913, the same year
the Federal Reserve was created. The CPI’s path over the 106 years since then displays
notable variations in inflation — or alternately stated, in the rate of
depreciation of the purchasing power of the U.S. dollar. In this post, I consider
the average inflation rates during successive 10-year and five-year periods, starting
in 1913. (The very last period, 2013-2018, includes six years.) I also note the
context of historical events. Wars, especially, induce accelerated government
money-printing, but the history displays constant inflation since 1933,
sometimes slower, sometimes much faster.
Which decades and half-decades are the inflation-control
champions, meaning the lowest average inflation rate without descending into
serious deflation? The decade champion
is that of Presidents Eisenhower and Kennedy, 1953-1962. Its average inflation
rate was 1.31 percent.
The booby prize goes to 1973-1982, when inflation averaged
the awful rate of 8.67 percent per year. No wonder Arthur Burns, who was chairman
of the Federal Reserve from 1970 to 1978, afterward gave a speech entitled “The
Anguish of Central Banking.” In second place for the booby prize is 1913-1922,
with an average inflation rate of 5.60 percent. That was the result of the first
World War. The decade included, first, double-digit inflation then a short,
very sharp depression in 1921-1922, but high inflation overall.
The inflation-control champion among half-decades is
1923-27, during the boom of the “Coolidge Prosperity,” when inflation averaged
only 0.47 percent. In second place is 1953-57 at 1.24 percent. At that time, William
McChesney Martin, who considered inflation “a thief in the night,” was chairman
of the Fed.
Table 1 shows the record by 10-year periods in chronological order. It also shows what $1 at the beginning of each period was worth in purchasing power at the end of each 10 years. The last column shows what $1 in 1913 was worth in purchasing power, as it depreciated over the entire 106 years.
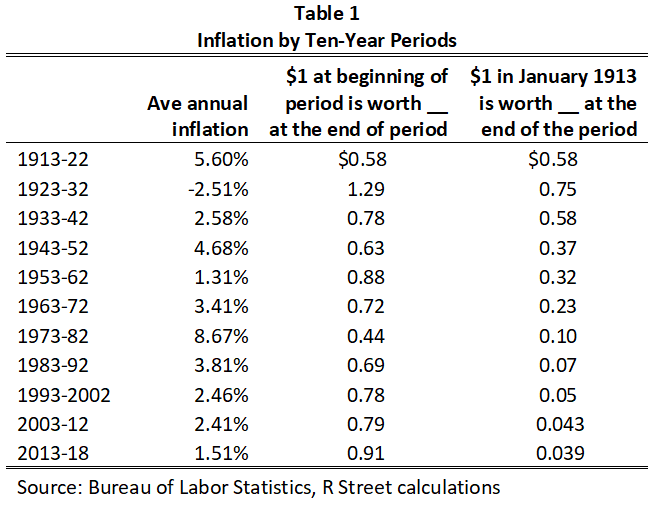
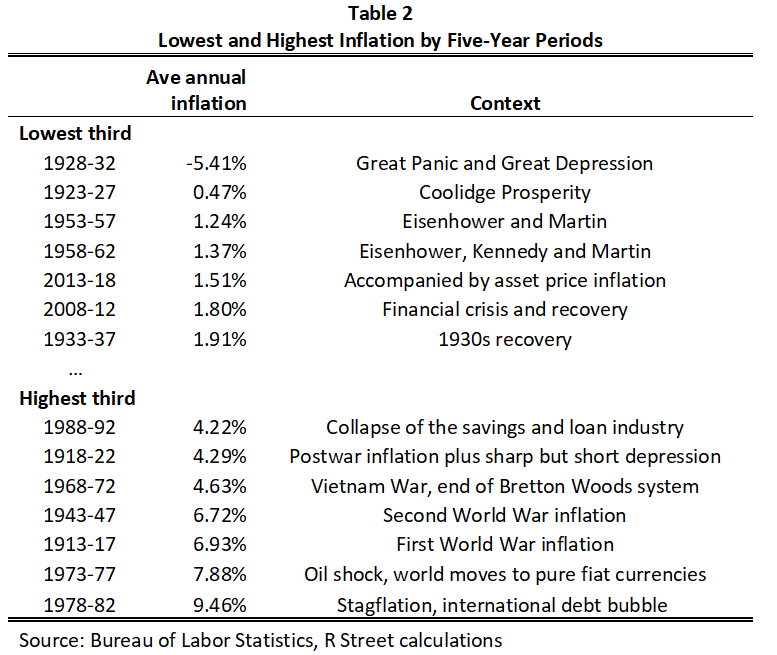
Table 2 shows the five-years periods, this time in order of lowest average inflation to highest, with historical notes on the context. It contrasts the lowest third of the observations with the highest third.
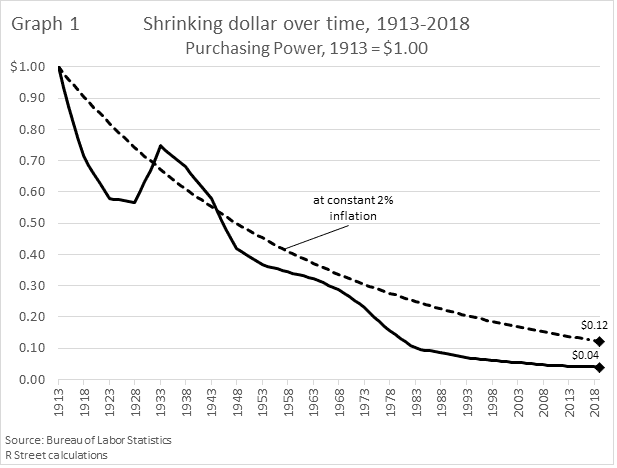
The average annual inflation over the 106 years was 3.11
percent. That reduced the $1 of 1913 to about 4 cents by the end of 2018, as
shown in Graph 1. Note that, because of the scale of the graph, the change
looks smaller in recent decades, but it isn’t. For example, the drop in
purchasing power from 1983 to 2013 is the same as that from 1943 to 1973—about 60
percent in 30 years in each case.
Many central banks, including the Federal Reserve, now believe in perpetual inflation of 2 percent. Had that inflation rate been maintained since 1913, instead of the actual 3.11 percent, the dollar’s purchasing power from then to now would have followed the dashed line on the graph and fallen to 12 cents, instead of 4 cents.
We know from history that big wars will always be financed, in
part, by depreciation of the currency of the winners, while the losers’ currencies
will often be wiped out. There were several wars in addition to the two world
wars in the 106 years under consideration, but was the constant inflation since
1933 necessary? Perhaps there was no other way for the government to deal with
the debt automatically produced when taxes are forever less than government
expenditures, war or no war, and the Federal Reserve is always there to help the
Treasury out by monetizing its debt.
Thanks to Daniel Semelsberger for research assistance.