June brings to mind weddings, homeownership and their paradoxical relationship
June, we learn from the National Association of Realtors, is “National Homeownership Month.” Since June is also a traditional month for weddings, it is a good time to address an important and logical, but little understood and virtually never-discussed connection: that between homeownership and marriage.
Homeownership is much higher for married than for not-married households. This makes intuitive sense. But the difference in homeownership rates is pretty remarkable: for the United States as a whole, more than 78 percent of married households own their home, nearly double the 43 percent for those not married. Thus, the overall homeownership rate of 63.5 percent is composed of two very different parts by marital status. This difference holds for all major demographic groups. The married versus not-married dynamic, in turn, gives rise to an intriguing homeownership paradox that we explore below.
We examine homeownership in this context over 30 years, from 1987 to 2017. This makes the homeownership effects of the housing bubble-and-bust into a temporary anomaly in the course of the three decades. That U.S. homeownership was artificially pumped up and then fell back to its trend now looks like a blip in the midst of the longer-term pattern. The artificial homeownership inflation was, of course, heavily promoted by the U.S. government, notably by the Clinton administration’s unwise “National Homeownership Strategy.” This strategy may be summarized as: pump up homeownership by making bad mortgage loans. Naturally, they didn’t say it that way—what they said was by making “innovative” mortgage loans. But it turned out the same.
Looking at the longer term, in 1987, the U.S. homeownership rate was 64 percent. Thirty years later, in 2017, it was 63.5 percent, according to the U.S. Census Bureau’s Current Population Survey.
But the homeownership rate for married households went up significantly over the same period: from 76.2 percent to 78.4 percent. And the homeownership rate for not-married households also went up a lot, indeed by a lot more than the married rate did: from 35.3 percent to 43 percent.
The sum of married plus not-married households are all the households there are. Their homeownership rates both went up from 1987 to 2017. So how is it possible that the overall homeownership rate went down? That is the paradox. It is summarized in Table 1.
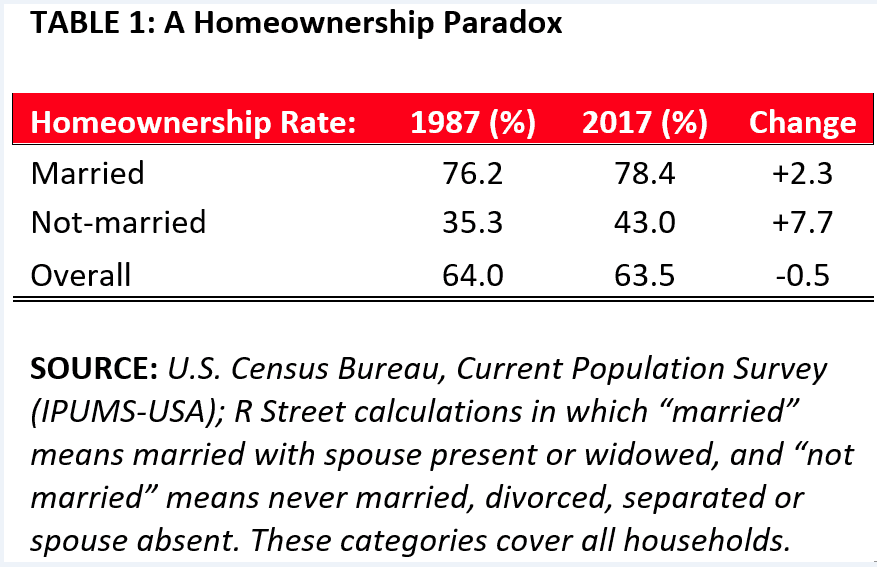
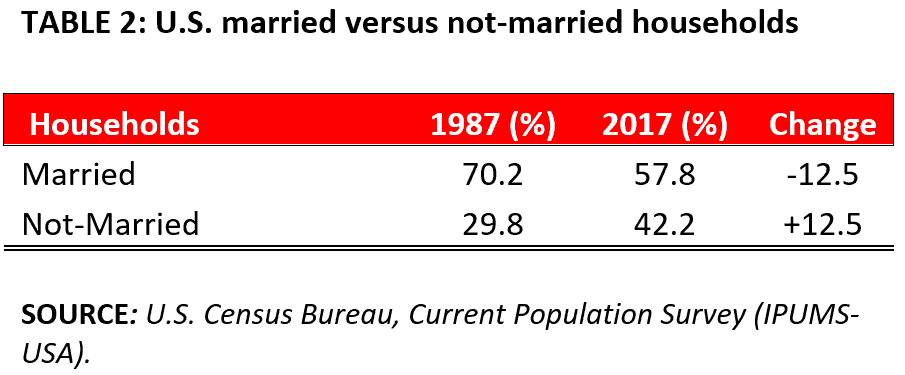
The explanation of the paradox is that the mix of married versus not-married households in the U.S. population changed a lot over these years. The proportion of married households, with their much higher homeownership, fell dramatically from 70.2 percent to 57.8 percent of U.S. households. The proportion of not-married households, with their much lower homeownership rate, correspondingly increased. This is shown in Table 2.
Adjusting out the effect of this shift in household mix, U.S. homeownership rates fundamentally rose over these three decades, as many of us would have hoped.
In sum, to understand trends in homeownership, we must include, as is seldom done, its interaction with marriage.
Image by ommaphat chotirat