Checks and Imbalances: Investment Disparity between Congress and the Presidency
From our earliest days in the classroom, we are taught that one of the defining features of the American system of government is the checks and balances written directly into the Constitution. The genius of the founders, framers and fathers stems from their recognition that men – and of course, for many, many years it was only men within government – were not angels, and that a lasting federal government must be structured in a way to combat their relentless ambitions for power and control over political processes and policy outcomes.
And so, in an effort to guarantee the representation of minority rights and to protect against majority steamrolling or autocratic impulses, three coequal branches of government were created: the legislative, or Congress, complete with its own internal check in the form of bicameralism; the executive, or the president and his executive agencies; and the judiciary, or the courts. Three branches each granted specific and enumerated powers denied to the other two. Each branch powerful in its own right, none omnipotent, all dependent on the others.
In Federalist 51, Madison explains the framers’ insistence on checks and balances when he states, “[E]xperience has taught mankind the necessity of auxiliary precautions. This policy of supplying, by opposite and rival interests, the defect of better motives, might be traced through the whole system of human affairs, private as well as public. We see it particularly displayed in all the subordinate distributions of power, where the constant aim is to divide and arrange the several offices in such a manner as that each may be a check on the other that the private interest of every individual may be a sentinel over the public rights.”1
Three coequal branches of government, each continuously serving as an effective check on the others. That was and is the theory, the ideal, and the goal of the American democratic republic. In reality, it is not so.2 Over the past decades, we have crept, sometimes lurched, away from the archetypal model laid out in the Constitution – the one taught to students in classrooms learning about their government for the first time. Presently, the branches are not equal – not even close.
The checks have become imbalanced.
Budget Authority as an Indicator of Priorities
The degree of this unevenness between the branches may come as a surprise to many. I state this with confidence because I was shocked when I broke down the numbers for this essay. I have worked for years on issues of congressional capacity and reform – researching, thinking and writing about how Congress can reassert itself as the First Branch of government and regain some of its self-forfeited powers even over duties itemized to only itself within the Constitution, such as policymaking and oversight of the executive branch. I knew the executive branch was big and growing, while Congress was much smaller and has remained stagnant, even shrinking, over the past few years. And yet, despite spending hours upon hours in spreadsheets and datasets of government information, I couldn’t fully answer how big the federal government is in terms of dollars or employees outside of the topline numbers I’ve used many times before: a $4.1 trillion annual budget and 2.1 million civilian employees.3
And therein lies a big problem stemming from a common misconception. As many suspect – and as many have argued around the proverbial dinner table – the federal government is huge. This is undeniable. But it’s not huge everywhere, at least not relative other parts of government. There are substantial disparities in the sizes and costs of programs, departments and agencies, and more fundamentally, between the branches of government themselves. By painting the entire government as too big, too costly, we effectively label every part of the government the same way without regard to the role we expect that portion to play in our system. We conflate who and what is big, and it greatly influences how willing the public is to detangle government productivity and success. We paint all parts of the federal government, despite having completely different roles and responsibilities, with the same broad brush.
Though of far less importance than the proper functioning of government, this conflation has made my job harder. As someone who advocates daily for the legislative branch – Congress – to reinvest in itself so that it can serve as the primary lawmaking authority as well as the check on the president it was designed to be, a main obstacle to our goal is the default position that government is already too big. Why would we invest more money in Congress, particularly given that it is incredibly unpopular, mired in partisan gridlock, and unwilling or unable to get things done?
My common retort has been that Congress would struggle to work well even if it wanted to. The institution doesn’t have the capacity or the resources to serve as a coequal branch of government, let alone the First Branch. Because of its own dearth of internal capacity, it has grown increasingly dependent on outside interests, many of which come with partisan agendas. Indeed, over decades, Congress has cut its own resources for short-term political gain and has deferred many policymaking and administrative decision-making responsibilities to federal and regulatory agencies staffed with far more permanent and experienced, though unelected, bureaucrats. This congressional disinvestment has happened under both parties’ majority leadership and has severely hampered Congress’ ability to serve as that all-important check, particularly when it comes to overseeing the executive branch’s decisions and actions.
This argument has worked well enough with folks already familiar with the problem, or who see Congress’ shortcomings regularly in practice. But it has fallen short outside of the District of Columbia bubble. I came to realize that a basic yet thorough dive of our government investments was necessary to help deconflate the all-encompassing tag of “big government.” A fact pattern is necessary to help the public and interested observers alike understand and make judgements about what their government costs and where and how much money is spent to maintain it year after year. Only then can we can have an informed and productive back-and-forth about where government is really too big and maybe, just maybe, convince some that the branches are not as coequal as we are taught.
So, I started with the most basic of questions: How much money are each of the branches actually authorized for their operations? Though a crude measure, budget authority levels are vital nuggets of information; they quantify the priorities of policymakers, political parties and the government itself.
Deciding on budget authority levels is one of the first steps of the federal budget process. These authority levels, agreed upon by both Congress and the president, set the maximums that federal agencies are allowed to spend on their programs under their respective jurisdictions. The levels are set after extensive negotiations between congressional budget committees and the president’s agencies, and especially between the two parties and chambers within Congress. The players involved haggle on dollar amounts to fund their campaign promises and preferred policies and programs. Their subsequent appropriations decisions – and thus the monies allocated to various governmental programs – are investments that signal what is important to lawmakers as they attempt to represent the needs and wants of their constituents and the country. Republicans, for example, tend to fight for higher spending caps for national defense and border security initiatives. Democrats, on the other hand, usually want greater funding put toward combating climate change and maintaining social safety nets. Budget authorities, then, serve as one of our best barometers of what lawmakers and parties care about; they tell us what our government decides to do and what it costs to do it.
Importantly, despite Congress holding the infamous ‘power of the purse,’ much of the federal budget – over 60 percent – is made up of mandatory spending, or spending that is mandated by law rather than by annual budget resolutions.4 That is, the spending levels for mandatory programs are all but automatic, often set by formulas. The vast majority of this type of spending funds three primary entitlement programs: Social Security, Medicare and Medicaid.
Another 30% of the federal budget – or just shy of $1.5 trillion – is dedicated to discretionary spending. As the name suggests, this is the portion of the budget in which lawmakers have discretion in funding and spending levels. Because discretionary spending is fungible and is altered on a yearly basis (and sometimes more often), this is the piece of the federal budget pie that the two political parties, Congress and the president publicly fight over. About half of the discretionary budget is allocated to defense-related agencies and programs, such as the Department of Defense.
The remaining 15% of the federal budget (half of the discretionary portion) pays for all other government programs – including executive agencies, the National Aeronautics and Space Administration, international assistantship programs and yes, the other two “coequal” branches of government.
How (Un)equal are the Branches?
Again, as a means of comparing interbranch spending, I wanted to see how much more money lawmakers have allocated to the executive branch and its myriad agencies relative to the legislative and judicial branches. Luckily, the White House Office of Management and Budget maintains historical tables showing nearly every feature of government spending and budgeting going back decades, including Table 5.4: “Discretionary Budget Authority By Agency: 1976-2024.”5 Within this single table, one can find the exact budget authorities in constant, fiscal year 2012 dollarsfor each of the three branches, as well as every federal agency and program making up the full discretionary budget, for the past 33 years.
So what do we find? For fiscal year 2018, the judicial branch had a budget authority of $7.102 billion, the legislative branch $4.835 billion and the executive branch $14.422 billion. This means that the president’s branch enjoyed a spending authority twice as large as all of the federal courts and a whopping three times as much as the entire legislative branch.
But, here’s the thing: I lied. That $14.422 billion was the budget authority for only the Department of the Interior, the executive agency responsible for maintaining U.S. federal lands. That’s all. It completely ignores all of the other federal departments, agencies and programs, such as the Civilian Corps of Engineers ($24 billion) and the Environmental Protection Agency ($8.9 billion), not to mention the nearly $700 billion for the Department of Defense.
If we look at the combined budget authority for all the president’s 14 executive civilian cabinet-level departments, the interbranch disparities get much, much worse. These agencies have a combined budget authority of over $630 billion for FY2018, or 130 times the budget authority granted to the entire United States Congress. In fact, as Table 1 shows below, every single one of the 14 departments has a budget authority that surpasses the legislative branch by orders of magnitude. The Department of Labor has the smallest budget authority ($12.337 billion), which is still 2.54 times Congress’ entire budget. The largest authority belongs to the Department of Health and Human Services ($100.1 billion), nearly 2,100% larger than that of Congress.
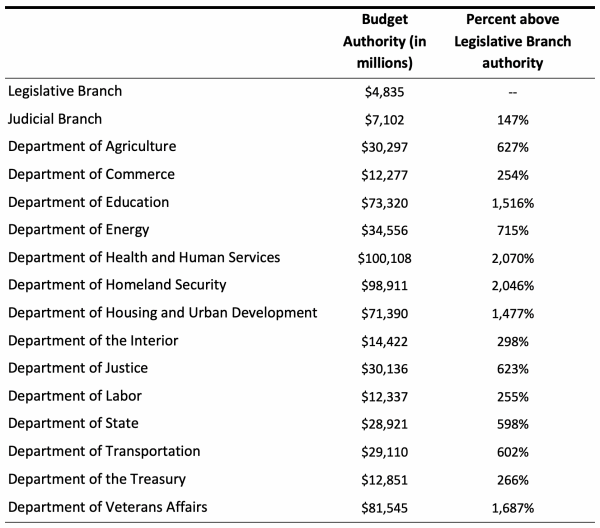
Table showing budget authority for each branch and agency, along with percent relative to legislative branch.
TABLE 1: BUDGET AUTHORITIES BY BRANCH AND AGENCY, FY2018
Source: Office of Management and Budget Historical Tables, Table 5.4
To get a sense of how the two spending-cap figures have changed over time, Figure 1 plots the ratio of executive branch civilian agency budget authorities to legislative branch budget authorities from 1976 to 2018 in constant FY2012 dollars. To reiterate, the executive branch number of just over $630 billion used in this analysis does not include the enormous Department of Defense. As the figure shows, at no point during this period did the combined budget authority of the president’s 14 nondefense departments fall below 67 times the funding for the legislative branch (1983). Since that nadir, we have seen a rise, though sometimes with small pullbacks, in the budget authority ratio, with a peak of the executive branch having a budget authority of over 153 times Congress’ budget in 2009 with the passage of the American Recovery and Reinvestment Act.

Line graph showing growth in said ratio over time, with decline from late 1970s to about 1983 and then stead increase to present.
FIGURE 1: EXECUTIVE TO LEGISLATIVE BRANCH SPENDING RATIO, 1976-2018
To be completely honest, comparing budget authorities and spending levels across branches and departments isn’t totally fair. After all, in addition to the salaries and benefits of agency bureaucrats, executive agencies budgets’ also often include incredibly expensive liabilities, such as the Department of Housing and Urban Development’s huge public housing buildings and subsidies, and the Department of Health and Human Services’ costly medical coverage programs. Congress, on the other hand, does not operate equivalent national programs, which clearly reduces its own budgetary demands. Yet with that said, the legislative branch budget does include multiple costly components, like the maintenance and repair of the House and Senate office buildings and the costs of the U.S. Capitol Police. While necessary, these items inflate the congressional budget without a correlated bump to improving Congress’ capacity as a legislative body.
Perhaps a more applicable measure, then, is comparing how agencies and Congress stack up on sheer man- and woman-power. In other words, how does the executive branch compare to Congress in the number of staffers getting paid to do the work of their respective bodies?
Staffing levels are another crude measure, but they speak to an organization’s internal capacity and performance potential in that the number of employees directly affects an organization’s ability to carry out its expected job functions. An agency with 1,000 employees, for instance, is simply expected and able to do more compared to one with 100. Governmental agencies with outsized staff counts often have a larger reach and greater programmatic demands and, because of their increased staff, are often in a better position to influence policy outcomes through administration. Using strict staff counts is in some ways fairer than using budget authority because it removes many of the expenses that are specific to certain agencies and don’t equally affect the budgets of other departments.
Staff counts are also crucial to comparing capacities across branches and departments for another reason: In the governmental context, staffers in the executive branch and those in the legislative branch ultimately serve two very different principals. As the saying goes, executive branch bureaucrats serve at the pleasure of the president. They are expected to carry out the wishes of the president – often triaged and articulated via his appointed agency heads – and conduct their work in pursuit of his preferred policy outcomes. For all and intents and purposes, in the executive branch, the executive controls the direction of his employees. Thus, there is one ultimate principal: the president. In Congress, despite the importance and predominance of political parties or congressional leaders, there is no singular boss. Staffers work to support the needs and wants of their individual member boss or, in the cases of committee staffers, the committee chairman or ranking member. Congressional human resources have been accurately described as 535 different and individualized legislative enterprises where the elected official serves as the CEO.6 In terms of manpower, then, such divergent organizational and power structures obviously favor the president.

Plot showing that Congress has considerably fewer staff than any all federal agencies represented.
FIGURE 2: STAFF COUNTS AT VARIOUS AGENCIES AND WITHIN CONGRESS, 2018
How does Congress match up with the president’s staffing resources? Unsurprisingly, it gets crushed. In 2015, Congress employed about 17,500 staffers in member and committee offices.7 The executive branch paid about 2,079,000 bureaucrats in the same year, of which 723,000 were employed by the Department of Defense (to say nothing of the hundreds of thousands of defense and government contractors not included within these numbers).8 Figure 2 presents agency level staff counts of the various civilian executive departments as reported by the Office of Personnel Management compared to the congressional counts maintained by the Brookings Institution. Again, Congress comes up in last place to each of the agencies, often by huge proportions. In fact, the smallest agency in terms of staff, the Department of Transportation (55,000 employees), still employs over 300% the number of people that Congress employs.
Let’s drill down even further. In order to delineate jurisdictions, capitalize on divisions of labor, and be better able to oversee the actions and administration of executive branch agencies, Congress maintains committees that largely line up with the responsibilities of those agencies. For example, both the House and Senate each have a Committee on Agriculture, on which elected members serve and produce agriculture- and farm-related policies with the help of committee-specific staffers. Because Congress is the lawmaking authority, it only writes the laws. The policies and programs are then implemented, administered and often interpreted by the Department of Agriculture and its staff. This committee/agency overlap is purposeful: It allows Congress to be that all-important check on the executive branch by monitoring how well the agency is carrying out the policies Congress passed. Through hearings, information requests and reporting requirements of the agency, the committee – and thus, Congress – is theoretically able to stay apprised of the inner workings of the agency and its processes.
The problem is that the committees don’t have the funds or the staffing to carry out truly effective oversight of their sister agencies. Again, consider the House Agriculture Committee. In the 115th Congress, the committee was authorized $11,437,517 to be split over the two years of the Congress – the vast majority of which was allocated to salaries for the 45 staffers serving the committee.9 By comparison, the Department of Agriculture boasted 94,000 staff with a budget of nearly $30 million for FY2018 alone. Forty-five staffers, many of whom serve in communications or administrative positions, are expected to oversee operations carried out by 94,000 staff all while researching, drafting and advancing agricultural policy proposals on behalf of the committee and its members. Similar disparities, sometimes even more lopsided, can be found across all departments and congressional committees. Not surprisingly, oversight is one of the first tasks that an overburdened committee drops. It simply isn’t a fair fight.
How Do These Disparities Affect Our Government Today?
Questions regarding congressional capacity lie at the heart of our governmental system – the genius of which is built on the checks and balances limiting each branch relative to the others. Government dominated by one branch is less democratic and subject to the very tyranny that the framers feared. Unfortunately, over the past several decades, Congress has disinvested in itself for short-term political gains – or, more specifically, to avoid short-term political losses in the eyes of voters who tend to believe that Congress, like the rest of the federal government, is too big. Because of these legislative branch cuts, Congress simply cannot compete and has forfeited, sometimes purposefully, power to the president and his bureaucracy. The branch has also increasingly turned to the courts to adjudicate policy disputes that it doesn’t want to legislate itself, and has empowered special interest groups to fill the information voids that lawmakers and staffers experience every day on every issue. This means that unelected bureaucrats and lobbyists, not elected members of Congress, are the ones with oversized influence on policy outcomes. This wasn’t the design intended.
Congress cannot even compete with the president on constitutional authorities expressly granted to the legislative branch. Take the power of the purse, for example. Congress alone has the power to authorize spending; the president and his agencies cannot spend without it being first authorized by Congress. And yet, Congress’ internal budget shop, the Congressional Budget Office, has only 250 employees and economists,10 compared to the 500 that staff the president’s in-house budgetary agency, the Office of Management and Budget. 11 This means that Congress is working at half the capacity of the president despite being the branch constitutionally responsible for authorizing the budget.
Now, I want to be clear that neither I, nor any other congressional capacity advocate I know, believe that effective checks and balances can only be accomplished if each branch was granted equal budgets or numbers of staffers to carry out its work. This obviously isn’t realistic or even necessary. But, we have a Congress that has become unable, and yes, often unwilling, to perform its duties and responsibilities – particularly when it comes to checking the increasingly powerful president and his bureaucracy. By making clear the incredible investment disparities between the two branches, perhaps we can have more productive, broader conversations that result in Congress returning to its rightful place as the First Branch of government.